It is sagacious to eschew obfuscation – so let’s be direct – the US stock market sucks right now.
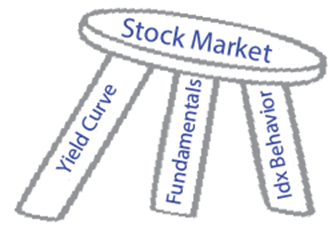
There are a number of problematic issues for stocks at this time, but let’s look at three key factors, as if they are three legs of a stool:
- Treasury yield curve
- Fundamental company operations
- Stock index and index constituent behaviors
There are many factors that influence these three things, but they are too many and their specific individual impact is too uncertain to be clearly interpreted. However, they are all assimilated into the markets and manifested by the three legs of our stool.
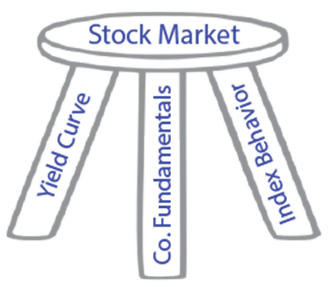
What is the condition of the stool (the stock market)?
- Treasury Yield Curve (positive): The curve is favorable to company operations and investment, to investor risk taking, and to household purchases on debt
- Company Fundamentals (negative): Revenue is declining, profits are declining and profit margins are declining, and credit worthiness of an increasing number of companies is in question (energy is a big factor)
- Index Behavior (negative): Stock returns are flat for the year, a narrow group of large companies is supporting the indexes while most stocks are doing poorly, and index intermediate price trends are negative.
We all know what happens to a stool when a leg is missing or one or two are too short – that is where we are right now in the stock market. 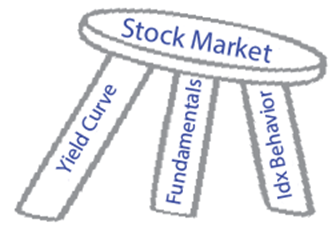
IMPLICATIONS FOR US STOCKS EXPOSURE
This does not mean a Bear market is on the way, nor does it mean the stock market will not rise next year. However, if does mean there is damage that needs to be repaired before the market can mount a sustainable advance. That repair will take some time – not days, not weeks; probably months, and possibly quarters.
The condition needs monitoring, and that is just what we are doing.
At this time we counsel above average cash positions, and below average allocations to each of bonds and stocks.
For those accounts where we have discretion, we raised extra cash back in July, and are waiting for the post-Fed rate rise period, and for US stocks to exceed their July high, before re-committing significant funds. In the interim, we may nibble here and there on individual securities that look particularly attractive
We agree with Bill Gross who recommended in his last monthly letter that both credit bond and equity exposures should be reduced.
We recommend a strong tilt to large-cap, high quality stocks with strong brand equity, solid financial condition, above average yield, consistent dividend growth and reasonable valuation multiples versus growth expectations. To the extent that the next year or so produces low total return, the dividend income component becomes relatively more important.
Actually, we always favor such stocks, so the change aspect to this is to reduce current exposure to momentum stocks, high leverage stocks, small-caps, non-yielding stocks, and lower quality stock generally. With respect to bonds, we suggest reducing exposure to low quality, high yield bonds until the bond market settles a bit.
In a period rising interest rates and slowing economies, companies with solid balance sheets with low debt-to-equity are a safer choice.
YIELD CURVE
The current yield curve is supportive of stocks. This chart shows the difference between a supportive yield curve, such as we have today; and one that is inverted and bad for stocks, such as we had in April of 2007 leading up to the Bear market.
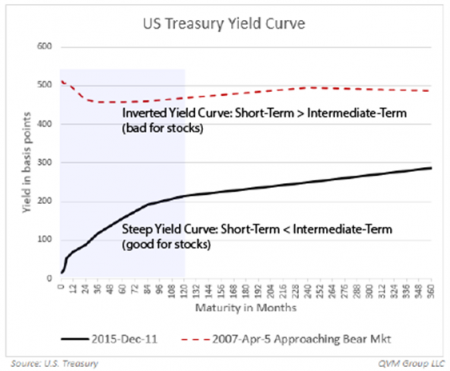
Check off the box for a positive yield curve stool leg.
COMPANY FUNDAMENTALS
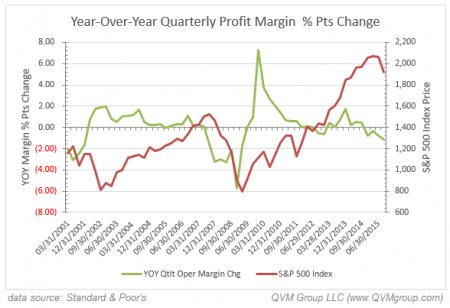
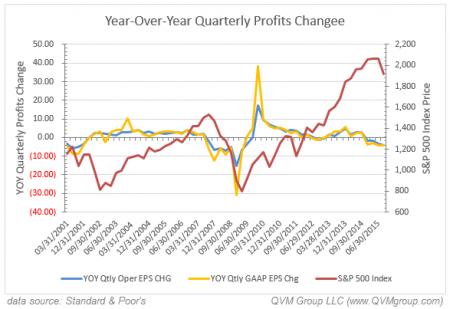
Sales are declining. Profit margins are declining. Reported earnings and S&P calculated operating earnings are declining.
These three charts show those dimensions (in green, left scale) versus the S&P 500 index price (in red, right scale).
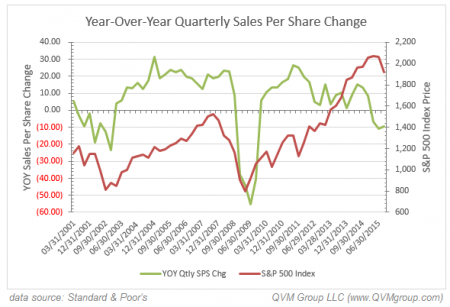
Check the box for a negative fundamentals stool leg.
For a little more color, here is a table that compares some internal breadth data for key S&P market-cap indexes:
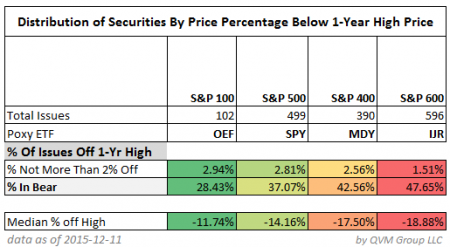
You can see that the larger-cap indexes are in better shape than the smaller-cap indexes: S&P 100 (mega-cap) better than S&P 500 (large-cap) better than S&P Midcap 400 (mid-cap), better than S&P 600 (small-cap).
More of the larger-cap index constituents are within 2% of their trailing high. Fewer of the larger-cap index constituents are in their own Bear markets. The median index constituent percent off of its 1-year trailing high is lowest for the largest-cap index, grading down to the greatest percentage off the trailing high for the smallest-cap index.
In a strong Bull, the smaller-caps outperform the larger-caps. In an aging and tired Bull market, the largest-cap stocks lead. This data suggests the Bull market is aging and deteriorating.
INDEX BEHAVIOR
We break the data in this leg into two parts: one for the index as a whole, and the other for the underlying components.
Part 1: The Index as Whole
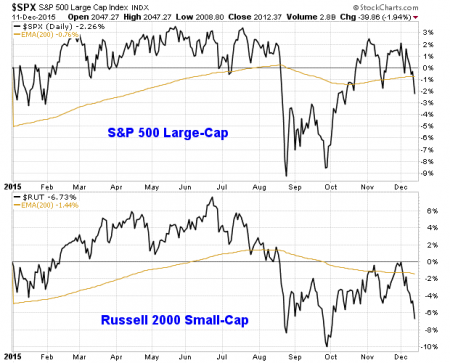
The price chart of the S&P 500 (large-caps) and of the Russell 2000 (small-caps) are weak, but not terrible.
This pair of charts shows the daily price and the 200-day average year-to-date for the S&P 500 and the Russell 2000. The small-caps are visibly weaker than the large caps. The small-caps need to improve before the large-caps are likely to have a sustained rally.
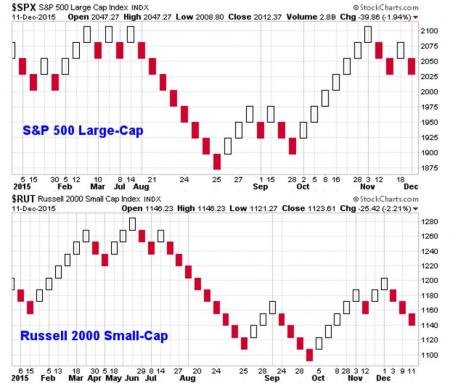
This next pair of charts shows the same indexes, but using a “noise canceling” plotting method, that only plots a new price box when the price moves by more than the 14-day average daily price change.
The S&P 500 chart shows more clearly how the index tried to exceed the 2100+ level three times earlier in the year, and then failed again just recently. The 2100 price level seems to be a current ceiling that poses significant resistance to the index.
The Russell 2000 chart simply shows the weakness in that index. In Bull markets the small-caps tend to outperform the large-caps.
When the small-caps lag the large-caps, there is a good chance the Bull is tired.
Part 2: Index Internals (Breadth)
Breadth refers to what portion of the constituent companies in an index are moving together.
In the current situation, a narrow group of large-cap stocks are rising, while most of the constituents are doing poorly. When large-caps are holding up the index, as it the current case, but the bulk of constituents are doing poorly; the indication is that the overall index is getting tired and likely to have a significant setback.
We look at a variety breadth indicators, most of which are neutral to negative. This table rates each indicators in a binary way, assigning either a +100 or -100 based on a value for that indicator that is either better or worse than a threshold. If there are two dimensions to an indicator and one is positive while one is negative, we assign a zero value to the indicator.
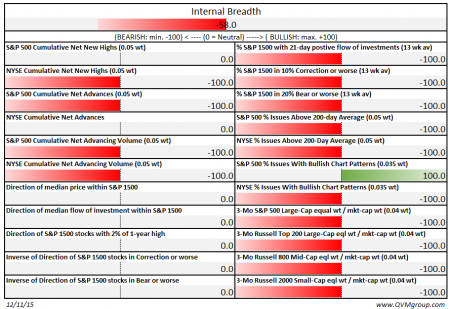
There are a couple of our indicators that we find particularly persuasive. Here are charts for them.
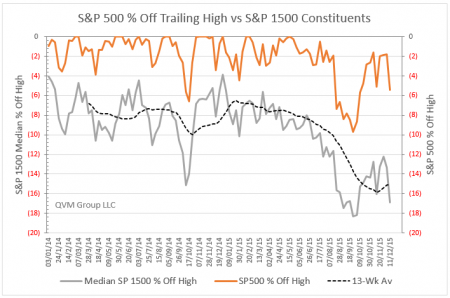
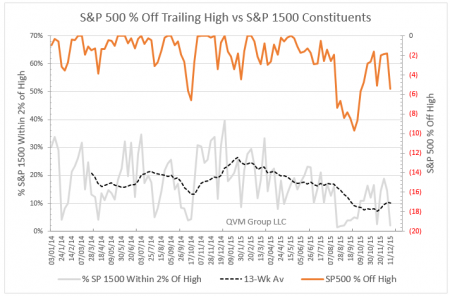
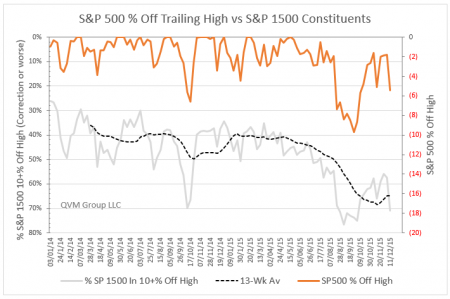
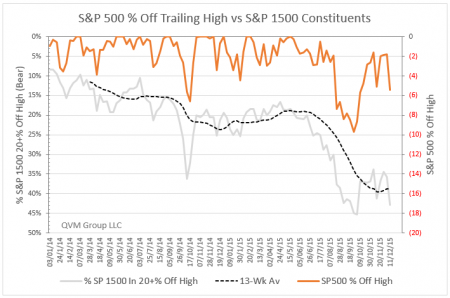
Each chart plots the percentage difference between the 1-year high price and the current price for the S&P 500 (in orange using right scale); and whatever the other dimension is in gray (for the weekly value) and in dashed black for the 13-week average of the weekly value, using the left scale.
This chart plots the distance from its 1-year high for the median stock in the S&P 1500 (the S&P 1500 is the sum of the large-caps, mid-caps and small-caps). You can see that while the S&P 500 index is off of its high by around 5%, the median S&P 1500 stock is off by 15% to 17%. That is a negative breadth indication.
This chart plots the S&P 500 position relative to its high versus the percentage of S&P 1500 stocks that are within 2% of their 1-year high. Only 2% (about 30 stocks) are within 2% of their high right now; and only about 10% (150 stocks) are within 2% on a 13-week moving average basis. That is very weak.
This chart compares the S&P 500 relative to its high versus the percentage of S&P 1500 stocks that are in a Correction or worse (off 10% or more from their high). Fully 71% are in a Correction or worse now; and 65% on a 13-week moving average basis. That’s bad.
This chart is like the one above, but it shows the percentage of S&P 1500 stocks that are in their own Bear market or worse (off by 20% or more). There are 43% in a Bear right now; and 39% on a 13-week moving average basis. That’s terrible.
Add up all those parts for the three legs of our stool, and we say this market is currently unattractive. Two legs are broken (or at least too short) and all we have that is really positive is the Treasury yield curve, which may not be enough alone to keep the stool from falling over.
KEY ANALYST FORECASTS FOR 2016 – 4.4% to 14.3%, average 2016 price return forecasted
[Last Friday closing price for S&P 500 = 2012]
Even though we see data suggesting a deteriorating US stock market, the analyst community is generally positive in their view for 2016.
There average price target by 15 firms for the S&P 500 is 2233 (11% higher than last Friday). The lowest targets (2100) are for a 4.4% rise. The highest target is 2500, which is a true outlier. The next highest target is 2300 (up 14.3%).
We hope they are right, and if/when they are right, the legs our stool will confirm that.
Here are their individual targets for S&P 500 2016 year-end price and earnings per index share, along with comments they made and/or the sectors they favor and expect to avoid.
2100 — Goldman Sachs (David Kostin) 2016 year-end target: 2,100 | 2016 EPS forecast: $120
“We forecast the S&P 500 index will tread water for a second consecutive year in 2016,”
Favor: Info Tech, Financials – Avoid: Consumer Staples, Energy, Materials, Utilities
2100 — BMO Capital Markets (Brian Belski) 2016 year-end target: 2,100 | 2016 EPS forecast: $130
“We believe the S&P 500 will likely suffer its first calendar year loss since 2008 … However, we continue to believe the longer-term outlook for US stocks remains bright, and we remain confident with our call that US stocks are in the midst of a secular bull market.”
2175 – Morgan Stanley (Adam Parker) 2016 year-end target: 2,175 | 2016 EPS forecast: $125.90
Favor: Financials, Consumer Discretionary – Avoid: Industrials, Energy, Consumer Staples
2175 – Black Rock (Russ Koesterich) 2016 year-end target: 2,175 | 2016 EPS forecast: $125
Favor: Financials, Technology – Avoid: Consumer Staples, Utilities
2200 – Citigroup (Tobias Levkovitch) 2016 year-end target: 2,200 | 2016 EPS forecast: $132.50
Favor: Financials, Energy, Technology — Avoid: Health Care, Consumer Discretionary, Materials
2200 – Columbia ThreadNeedle (Jeffery Knight) 2016 year-end target: 2,200 | 2016 EPS forecast: $126
Favor: Technology – Avoid: Utilities, Materials
2200 — Bank of America Merrill Lynch) (Savrita Subramanian) 2016 year-end target: 2,200 | 2016 EPS forecast: $125
“We expect modest gains for US large cap stocks in 2016: the likelihood of a recession in the next 12 months is low in our view, but valuations have normalized from previously low levels and narrowing returns are to be expected,”
2200 — Credit Suisse (Andrew Garthwaite) 2016 mid-year target: 2,200 | 2016 forecast: 6.8% growth
“We think that we are at the later stages of the equity bull market and see increasing headwinds for equities related to valuations, an uncertain macro environment, bottom-up disruptions, weak earnings momentum, and falling market breadth,”
2200 — Barclays (Jonathan Glionna) 2016 year-end target: 2,200 | 2016 EPS forecast: $111
“Our macro narrative is simple, if obvious … We believe U.S. interest rates will go up leading to a stronger U.S. dollar. This should cause earnings per share growth and returns to remain subdued. We forecast 4% EPS growth and a 5% gain for the S&P 500.”
Favor: Financials, Energy – Avoid: Consumer Staples
2200 – JP Morgan (Dubravko Lakos-Bujas) 2016 year-end target: 2,200 | 2016 EPS forecast: $123
Favor: Energy, Technology, Financials – Avoid: Utilities, Telecom, Industrials
2250 – Prudential (John Praveen) 2016 year-end target: 2250 | 2106 EPS forecast: $122
Favor: Financials, Info Tech – Avoid: Materials, Utilities
2275 — UBS (Julian Emanuel) 2016 year-end target: 2,275 | 2016 EPS forecast: $126 | range (2,500 to 1,750)
“Barring an unforeseen external shock or a recession, if earnings continue to improve, 2016 should be a positive year for US equities … Regardless, we continue to expect further volatility — which in essence means higher risk, both upside and downside.”
2275 — Deutsche Bank (David Bianco) 2016 year-end target: 2,250-2,300 | 2016 EPS forecast: $125
“We reduce 2016E S&P EPS from $128 to $125 … We’re unsure of the tone of language appropriate to describe this reduction. Slashing or even cutting is too harsh as our new estimate is merely 2.5% lower. This trimming shouldn’t surprise investors given recent commodity and currency markets.”
2300 — RBC Capital Markets (Jonathan Golub) 2016 year-end target: 2,300 | 2016 EPS forecast: $128
“2015 was marked by falling oil prices, a diminishing global growth outlook, and flat rates … Our constructive 2016 outlook is predicated upon stabilizing commodity prices, and an incrementally higher dollar and rates. All of this should result in a substantially higher earnings trajectory as well as a modest re-rating of stocks.”
2500 – Federated Investors (Steven Auth) 2016 year-end target: 2,500 | 2016 EPS forecast: $125
Favor: Financials, Health Care, Technology, Industrials – Avoid: Energy, Materials
US SECTORS
This table consolidates the analyst recommendations on sectors. We also added some sector data to help put their views in perspective:
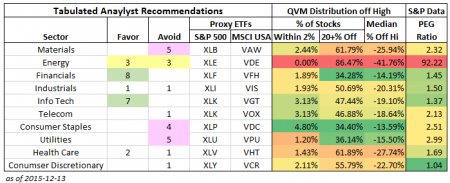
The green highlighted sectors are those with the most favorable expressions (Financials and Information Technology). The pink shaded sectors are those with the most recommendations to avoid (Materials, Consumer Staples, and Utilities). The yellow shading on Energy shows a split between those who expect more poor performance and those who expect a recovery and good performance.
To tie back into our discussion of internal breadth, we added three breadth dimensions to the table:
- The percentage of sector stocks within 2% of their 1-year high
- The percentage of sector stocks in their own Bear market (down 20+%)
- The percentage by which the median sector stock is below its 1-year trailing high
Clearly, Energy is in the worst current condition and Consumer Staple are in the best current condition. Energy will depend on the price of oil next year, which is anybody’s guess. Consumer Staples may be over-bought due to yield pursuit, and they may suffer somewhat as interest rates rise.
To add an element of valuation, we present the PEG ratio (1 year forward P/E ratio divided by the 5-year expected earnings growth rate) for each sector as published by Standard and Poor’s. Since lower (but positive) numbers are better, and under 2x is desirable, Financial, Industrials, Information Technology, Health Care and Consumer Discretionary look best by this metric.
VALUATION
There are many valuation measures to be considered. We will address them in some detail in a subsequent letter. For now, this is important to say: Over-valuation or under-valuation alone does not make markets rise or fall. Other facts need to stimulate trend change in markets. Markets can remain over-valued or under-valued for long periods.
Most measures today either support the US stock market as fairly-valued or over-valued. There is not too much out there for under-valued.
While fairly-valued or over-valued is not likely to make the market retreat, those levels make it a lot harder for the market to put up large total return results. It is a lot easier to generate high total returns beginning with under-valuation than from a fairly-valued or over-valued market.
CLOSING THOUGHT
Our view at this time is that probability weighted risk exceeds probability weighted gains potential; and given that, those in or near retirement should emphasize capital preservation more than capital growth in the short-run for now.
ETFs or Indexes Mentioned in the Article::
- S&P 500: SPY, IVV, VOO
- Materials Sector: XLB, VAW
- Energy Sector: XLE, VDE
- Financial Sector: XLF, VFH
- Industrial Sector: XLI, VIS
- Info Tech Sector: XLK, VGT
- Telecom Sector: XLK, VOX
- Consumer Staples Sector: XLP, VDC
- Consumer Discretionary Sector: XLY, VCR
- HealthCare Sector: XLV, VHT
- Utilities Sector: XLU, VPU
- Russell 2000 Small-Caps: IWM
- S&P 600 Small-Caps: IJR
- S&P 400 Mid-Caps: MDY
- S&P 1500: ITOT (scheduled to change benchmark Dec 18, 2015)
