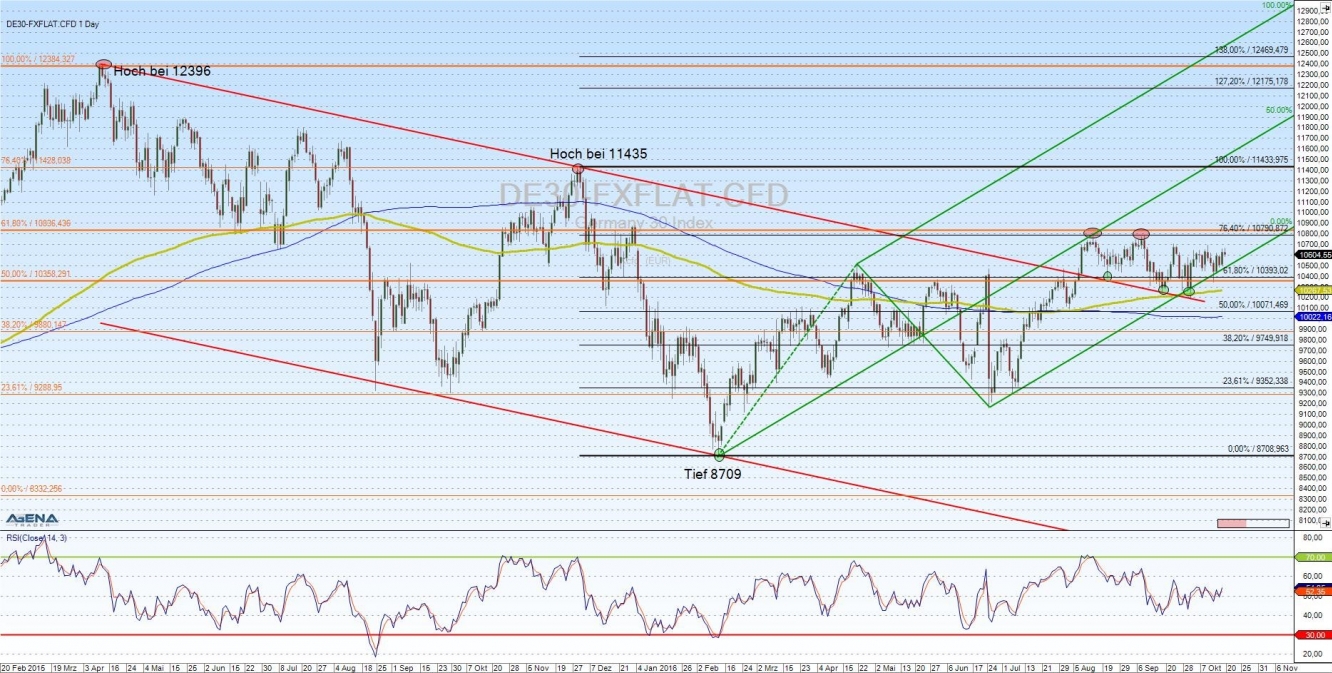
Since the last analysis from 07.10.2016, the prices of the DAX index have been fluctuating in a range between 10400 and 10700 points. The index is currently at approx. 10,600 points. In the last few days, it got very interesting in the daily basis, since the prices drew closer to the lower AP line and tested this support several times.
Precisely at this rising AP trend channel limit was where the DAX was able to turn upwards again and again, and remains in an upwards trend in the daily chart still. However, it is almost a daily possibility that the green rising pitchfork will be exited downwards, which would consequentially lead to a trend change.
This could cause the DAX prices to fall into the area of the 200 EMA line at 10,267 points again, and even deeper until 10,070 points, where the 50% Fibonacci retracement runs. However, as long as the green AP is not exited, it could well go further upwards until at first 10.800 points and even 11,000/11,200.
Chart: AgenaTrader
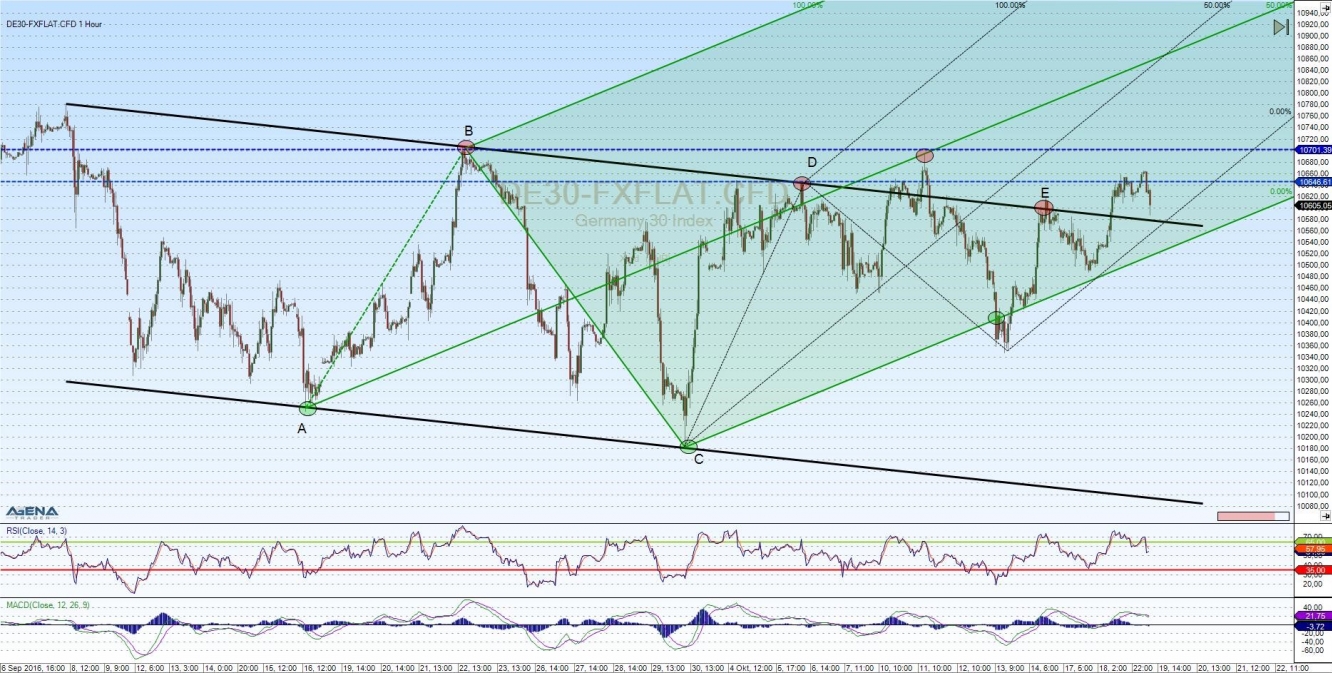
When we now observe the situation in the 1-hr. chart, we see that this is also dominated by a green, rising pitchfork, which was constructed from the points A, B and C and is in existence since 30.09.2016, and has represented the price development for weeks. Also of great importance is the black trend channel, which is defined by the points ABCD and E.
On 11.10, there was a breakout from the trend channel, whose price increase, however, ended exactly at the median line of the Andrew’s Pitchfork. After this, it carried on further down until the lower AP limit, only to then start a renewed breakout attempt out of the trend channel. The price bounced off once again at the point E and fell back into the area of the lower pitchfork limit, to then break out of the trend channel upwards on 18.10.2016.
As long as the DAX does not considerably surpass the high points B and D at 10,700 and 10,650 respectively, the situation will remain suspenseful. Currently, the breakout line of the trend channel at approx. 10.580 could provide a support on the way up. There would then be upwards potential until the median line at approx. 10.850 points.
Below 10,500 points, however, the situation looks rather more bearish again. What is also interesting, by the way, is the very similar price development in the daily chart from April 2015 until today (image 1) compared with the 1-hr. from 07.09.2016 until today (image 2).
Chart: AgenaTrader
IMPORTANT NOTE: Exchange transactions are associated with significant risks. Those who trade on the financial and commodity markets must familiarize themselves with these risks. Possible analyses, techniques and methods presented here are not an invitation to trade on the financial and commodity markets. They serve only for illustration, further education, and information purposes, and do not constitute investment advice or personal recommendations in any way. They are intended only to facilitate the customer’s investment decision, and do not replace the advice of an investor or specific investment advice. The customer trades completely at his or her own risk.


