Global data, FOMC support firmer dollar
The verdict from yesterday’s data was unanimous: it all supports a stronger dollar. Data from Japan, Europe and the US agreed.
As I mentioned yesterday, Japanese industrial production plunged in June, a stunning contrast to the surge in output in neighboring South Korea during the month, so it can’t be put down to a sluggish world economy. Then German inflation slowed in July, signifying a poor supply/demand balance in Europe’s largest economy and suggesting that the Eurozone inflation too may move lower, a negative for the euro.
The US data though was the clincher. The ADP employment report was lower than expected at 218k vs a market forecast of 230k, but the figure remains over 200k and in any event some payback from the previous month’s 281k was inevitable. Then came the GDP figures. Not only was Q2 far above estimates (+4.0% qoq SAAR vs forecast +3.0%) but also Q1 and all of the second half of last year were revised up as well, meaning that 2013 yoy real GDP growth was revised up to 3.1% from 2.6%. On top of which, the Q2 core PCE deflator grew 2.0% annualized, meaning the FOMC has hit one of its two targets.
The better economy and higher inflation were reflected in the FOMC statement. There were no significant changes in their policy guidance, but the tone of the statement was nonetheless slightly more hawkish, in line with the improvements in the economy. They noted that inflation is moving towards their target and that labor conditions had “improved.” But on the other hand, they emphasized that other indicators besides the unemployment rate show continuing difficulties in the jobs market. The market focused on that point and interpreted the statement as dovish, which I think is a misinterpretation. It looks to me as if the Committee is trying to play down the improvement in the unemployment rate and instead focus on other indicators that still show a difficult labor market to enable them to keep their flexibility about the timing of a rate hike. For example, there may be more emphasis from now on the broadest measure of unemployment, the U6 measure, which includes people “marginally attached to the labor force” as well as those with part-time jobs who want to work full-time but can’t find full-time jobs. This version remains quite elevated.
Philadelphia Fed President Plosser dissented, as he thought the statement did not “reflect the considerable economic progress that has been made toward the Committee’s goals.” There are likely to be more hawkish dissents as time goes by.
Looking at the improvement in the US economy and the changes in the statement, it appears to me that the FOMC is on course to finish tapering off its bond purchases as scheduled in October. Moreover, if the next several labor and inflation reports continue to move in the same direction that they have been moving, we could soon see more concrete indications of when the Fed will begin raising rates. So far the FOMC’s own forecast is that rate hikes are likely to begin in February next year, vs the market’s forecast of August. I think the market will have to move closer to the FOMC’s way of thinking and that this change in market view will continue to provide support for the dollar going forward.
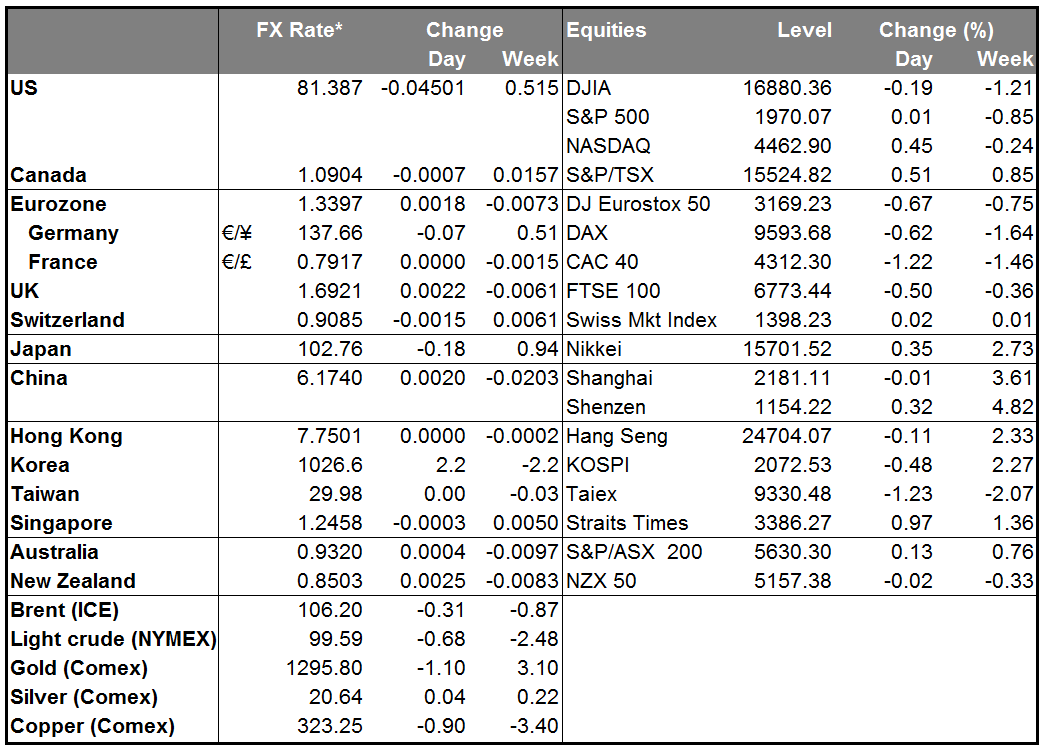
The data and the FOMC report bolstered the dollar against almost every currency we track, both the G10 and EM currencies. The EUR/USD is opening in Europe below 1.34 for the first time since last November, while the GBP/USD is opening lower for the 10th day out of the last 15. Turnover increased notably and there was apparently heavy demand for currency options in the US as investors think we could be entering into a period of greater volatility. Although as I noted recently the daily ranges are some of the narrowest on record, on the other hand looking at the rates from the beginning of the month to the end, it appears that currencies are starting to trend. The range for the EUR/USD in July as a whole has been 2.5%, which is more than half the year’s range of 4.7%. The July range is not as much of the year’s range for the USD/JPY or GBP/USD, however. The EUR/USD may finally be starting to show the effects of the divergence in monetary policy between the ECB and the Fed.
Today: During the European day, the UK Nationwide house price index is forecast to have slowed to +0.5% mom in July from +1.0% mom the previous month. GBP has been weak recently and a figure like that could be an excuse for further selling. Germany’s retail sales are also coming out and the forecast is for a rebound in June’s figure. We also have the German unemployment rate for July and Eurozone’s unemployment rate for June. Both rates are expected to have remained unchanged, at 6.7% and 11.6% respectively. The bloc’s CPI estimate for July is also coming out and is expected to remain at June’s 0.5% yoy. Yesterday’s German CPI had only limited impact on the euro so this is likely to too if it is within estimates.
From Canada, the GDP for May is expected to have increased by 0.4% mom, an acceleration from +0.1% in April, driving the yoy rate up to 2.3% from 2.1%. That could cause some profit-taking in USD/CAD.
In the US, the Chicago purchasing managers’ index for July is forecast to have slightly increased. The initial jobless claims for the week ended 26th of July are also coming out and the forecast is for the figure to increase marginally. These figures are not dramatically better but as long as they are not worse, they should not derail the dollar from its upward trajectory, in my view.
The Market
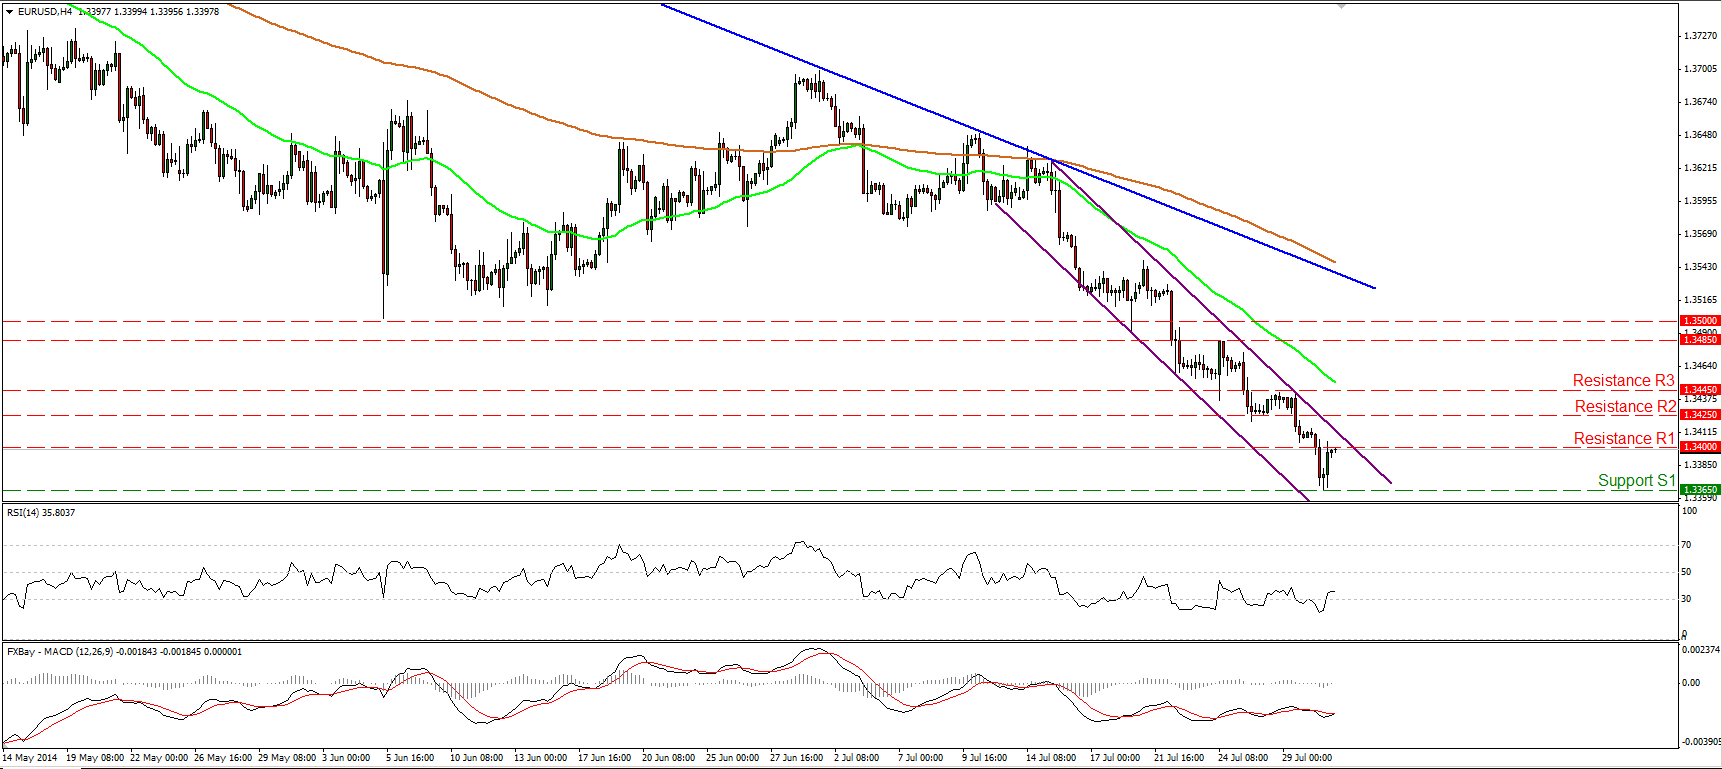
EUR/USD dips below 1.3400
EUR/USD fell below our support barrier (turned into resistance) of 1.3400 on news that the US economy grew more than anticipated in Q2. Nevertheless, the decline was halted at 1.3365 (S1) after the dovish comments in the FOMC statement regarding the labor market. EUR/USD moved higher after the statement was published and at the European opening is testing the 1.3400 zone as a resistance this time. The price structure remains lower highs and lower lows below both the moving averages, and this keeps the short-term path to the downside, in my view. I still expect the rate to hit 1.3350 (S2), where a clear break could pave the way towards the next support at 1.3300 (S3). On the daily chart, the 50-day moving average lies below the 200-day one, adding to the negative picture of the currency pair.
• Support: 1.3365 (S1), 1.3350 (S2), 1.3300 (S3).
• Resistance: 1.3400 (R1), 1.3425 (R2), 1.3445 (R3).
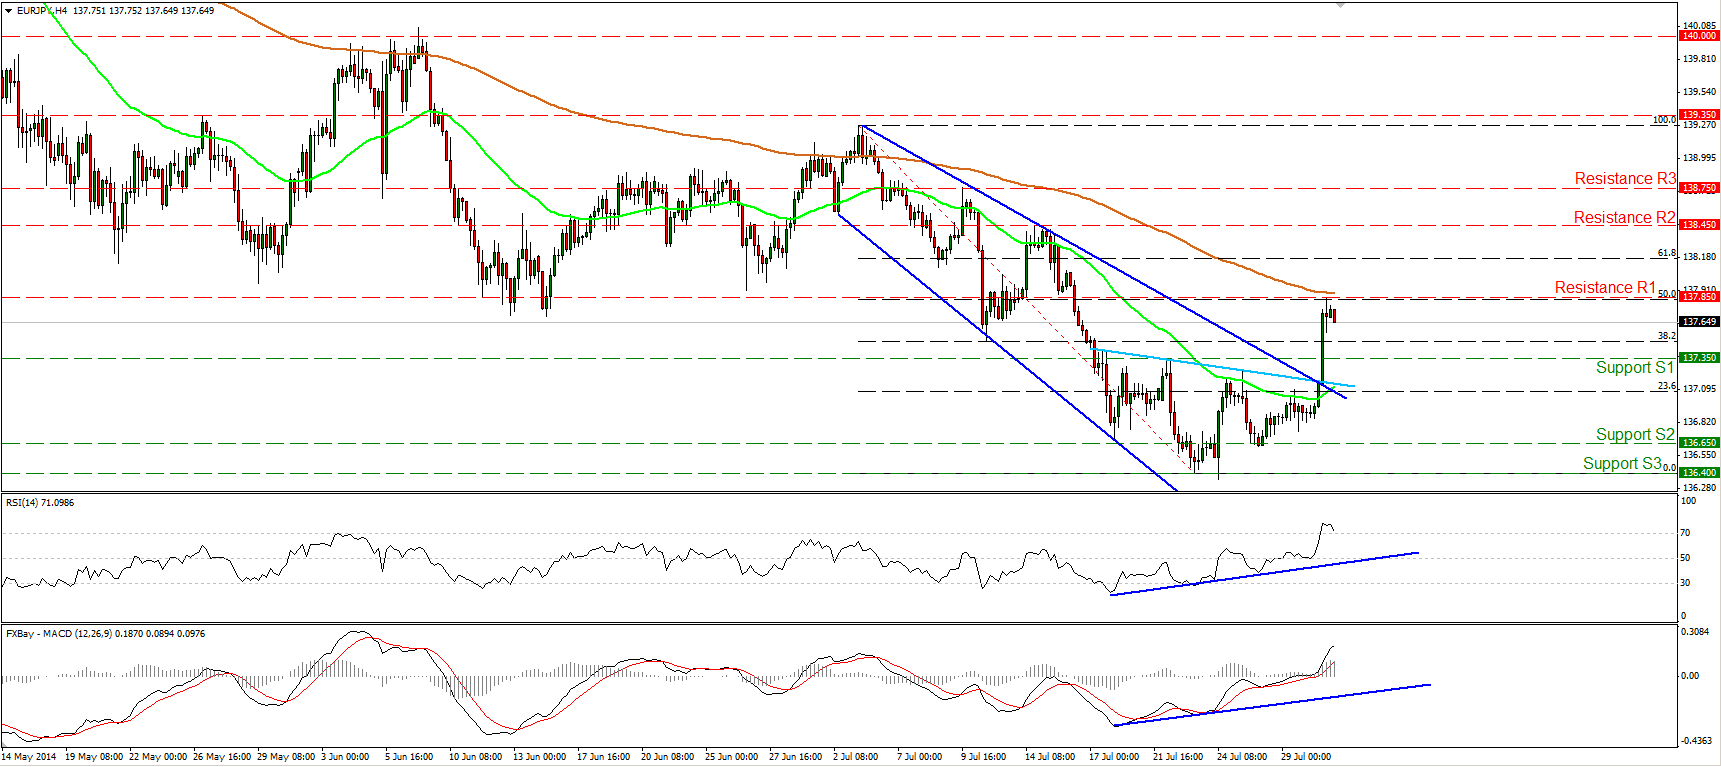
EUR/JPY surges
The EUR/JPY rallied and violated the resistance bar (turned into support) of 137.35 after forming a morning doji star on the daily chart. The move signaled the completion of the possible near-term inverted head and shoulders mentioned in previous comments and confirmed a forthcoming higher high. The rally was stopped by the 50% retracement level of the 3rd July – 24th of July decline, at 137.85 (R1), marginally below the 200-period moving average. A move above that area is likely to drive the battle towards the next resistance at 138.45 (R2). Nonetheless, considering our hourly momentum studies, I would expect some consolidation or a pullback near the 137.85 (R1) area. The 14-hour RSI moved lower after exiting overbought conditions, while the MACD fell below its signal line.
• Support: 137.35 (S1), 136.65 (S2), 136.40 (S3).
• Resistance: 137.85 (R1), 138.45 (R2), 138.75 (R3).
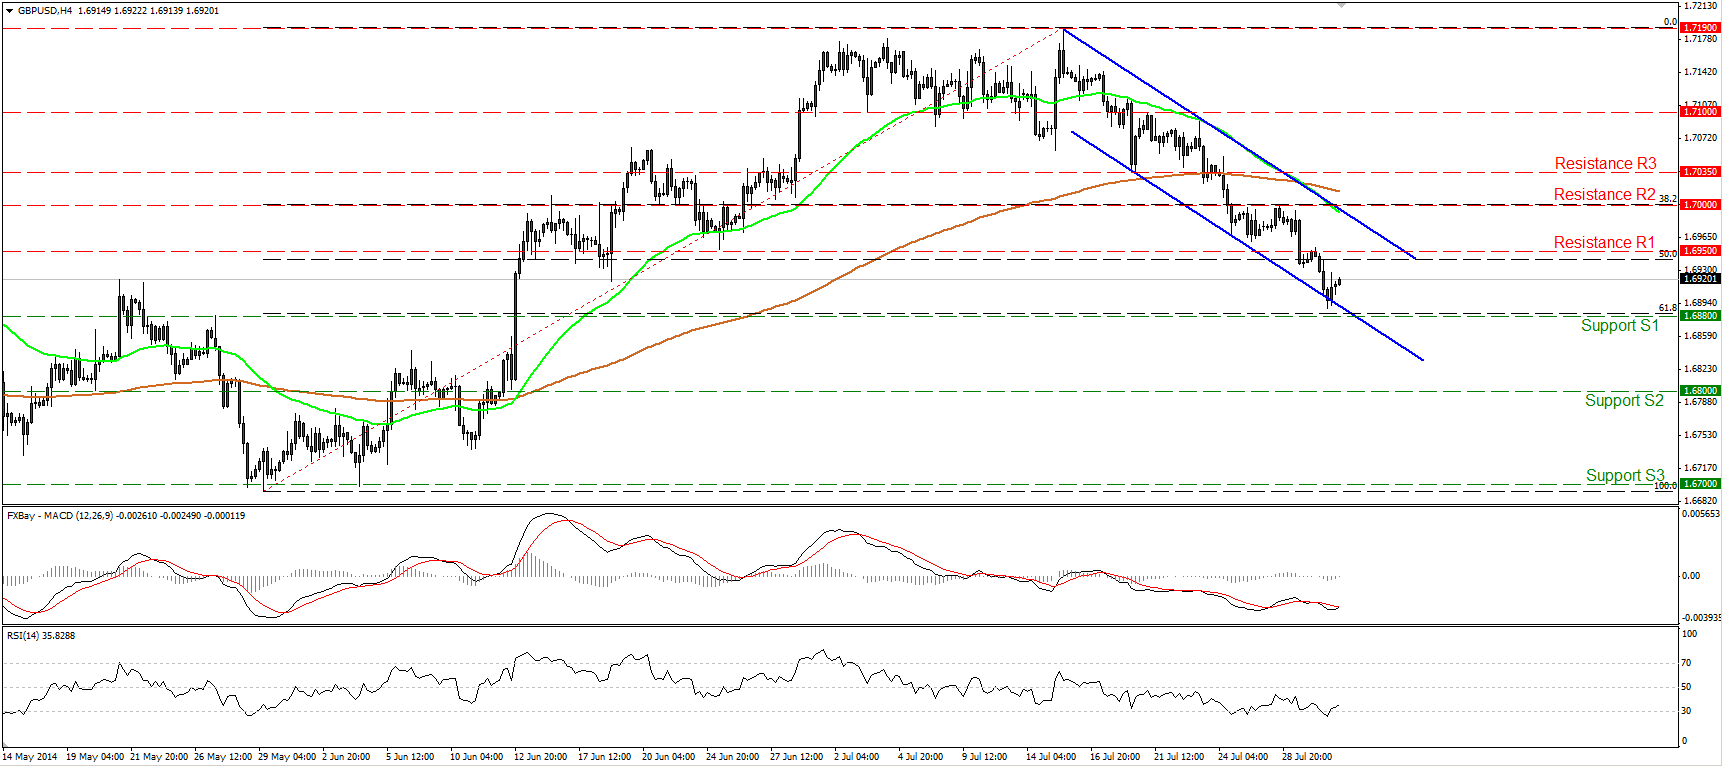
GBP/USD is testing the 80-day EMA
The GBP/USD continued declining yesterday, moving below the 1.6950 barrier and the 50% retracement level of the 29th May – 15th of July advance. The rate found support slightly above our support of 1.6880 (S1), which coincides with the 50% retracement level of the aforementioned up move. On the daily chart, the rate is now testing the 80-day exponential moving average, which provided reliable support to the lows of the price action during the current long-term uptrend. As I said in my last comment on Cable, I would give up my bearish stance as far as the short-term picture is concerned (despite the fact that the rate remains within the near-term downside channel) and I would wait to see the market reaction near that zone before reconsidering my analysis.
• Support: 1.6880 (S1), 1.6800 (S2), 1.6700 (S3).
• Resistance: 1.6950 (R1), 1.7000 (R2), 1.7035 (R3).
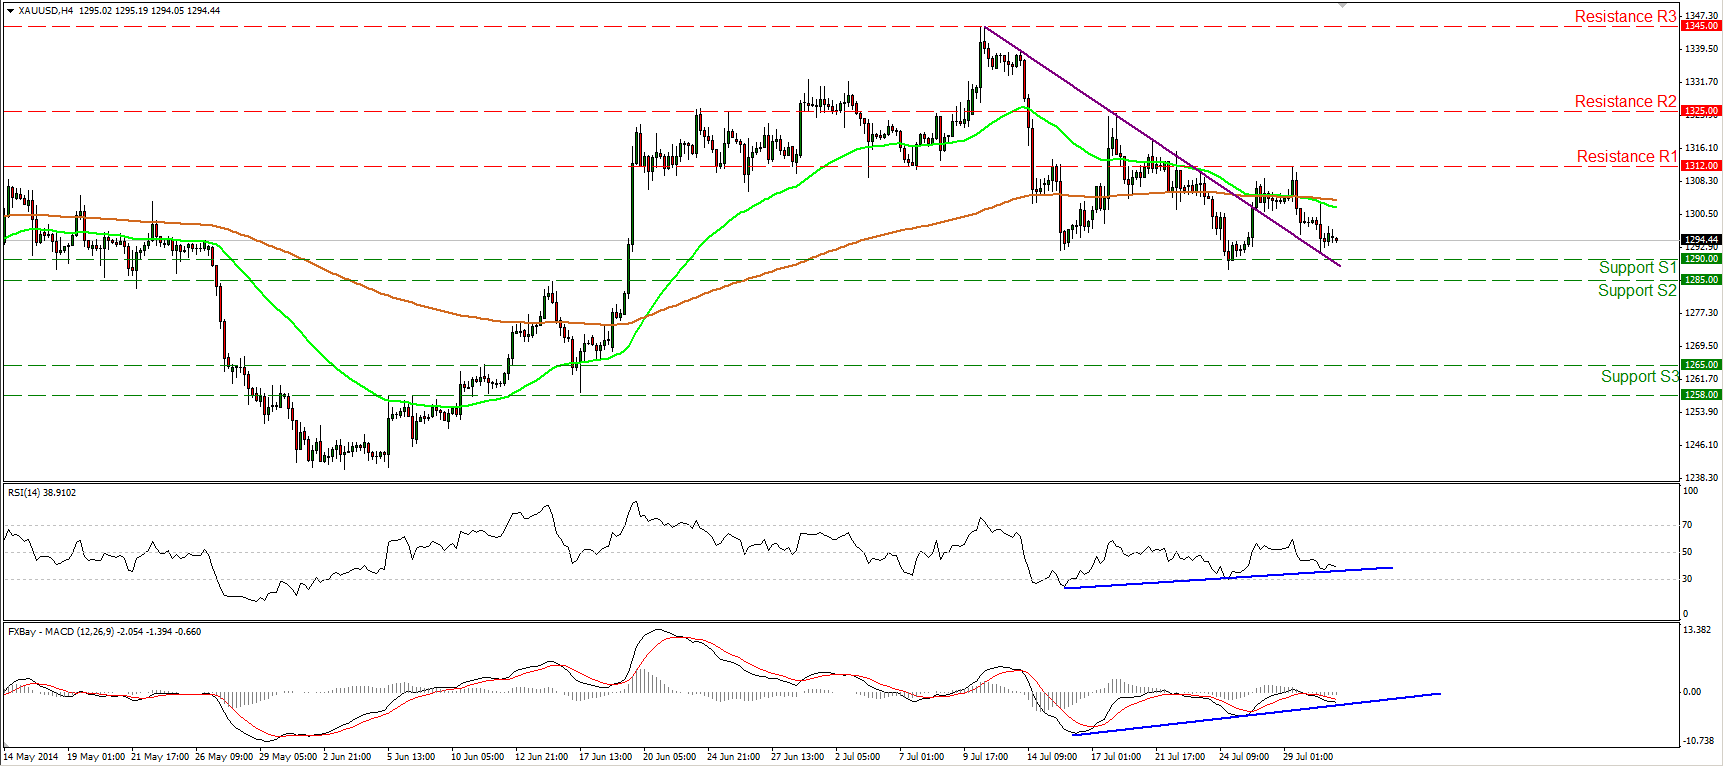
Gold not choosing direction
Gold moved somewhat lower, remaining marginally above the prior downside trend line. The precious metal remains within the range between the support zone of 1285/90 and the resistance of 1312 (R1), which coincides with the 200-day moving average. Although the positive divergence between our momentum indicators and the price action is still in effect, the 50-period moving average remains below the 200-period one, which is a negative signal. Bearing in mind these mixed technical signals, I would maintain my flat view for now. On the daily chart, both the 50-day and 200-day moving averages are still pointing sideways, confirming the unclear picture of gold.
• Support: 1290 (S1), 1285 (S2), 1265 (S3).
• Resistance: 1312 (R1), 1325 (R2), 1345 (R3) .
WTI tumbles below 100.45
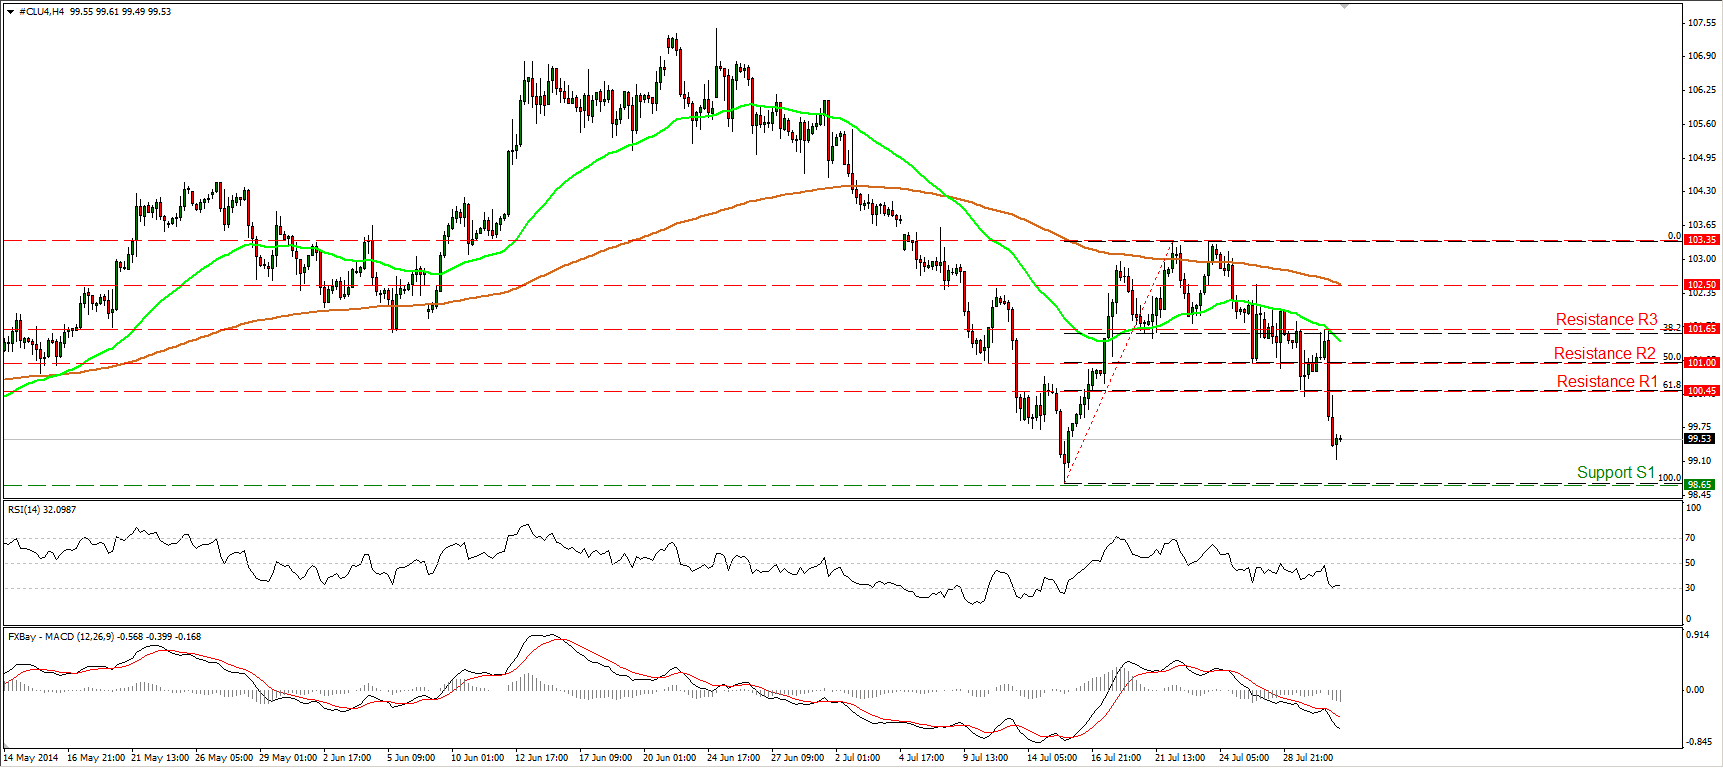
WTI plunged on Wednesday, falling below the 100.45 hurdle, the 61.8% retracement level of prior near-term advance. This confirms my view that a move below that level would carry larger bearish implications. I still expect WTI to challenge the lows of the 15th of July, at 98.65 (S1). However, zooming on the 1-hour chart, I see that the 14-hour RSI tries to exit its oversold field, while the hourly MACD shows signs of bottoming and could move above its signal line in the near future. As a result, I would expect some short-covering before sellers prevail again.
• Support: 98.65 (S1), 98.00 (S2), 97.30 (S3).
• Resistance: 100.45 (R1), 101.00 (R2), 101.65 (R3).

