We have added the Dallas Fed Texas Manufacturing Outlook Survey (TMOS) focusing on the General Business Conditions Index to our series of regional Fed updates. This indicator measures manufacturing activity in Texas.
Here is an excerpt from the latest report:
Texas factory activity declined slightly in July, according to business executives responding to the Texas Manufacturing Outlook Survey. The production index, a key measure of state manufacturing conditions, remained negative but rose for a second month in a row to -1.9, suggesting further moderation in the decline in manufacturing output.
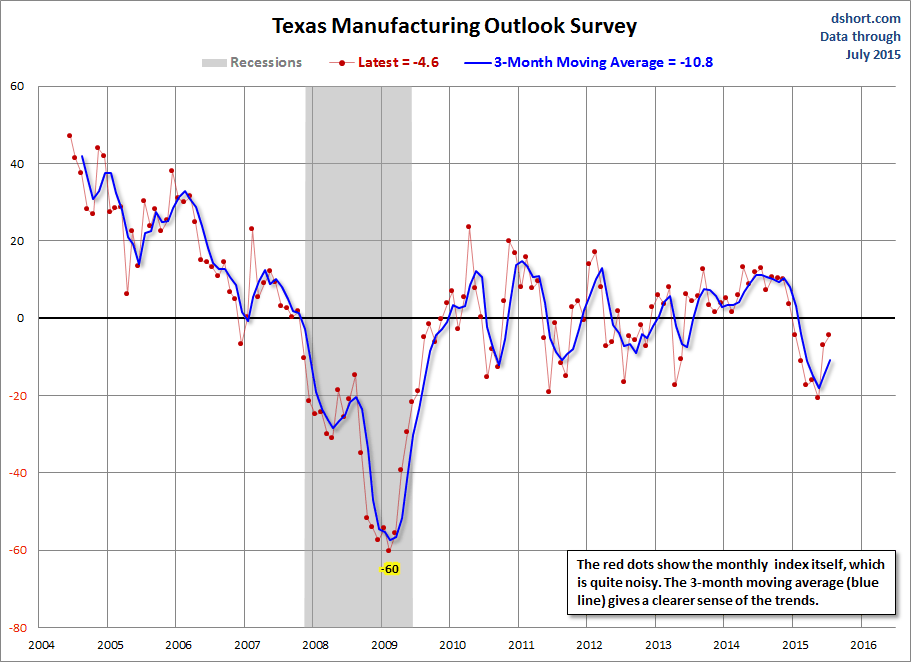
Perceptions of broader business conditions were mixed. The general business activity index remained negative, but it rose for a second month in a row and reached -4.6 in July. Manufacturers expect improved conditions ahead. The company outlook index surged nearly nine points and posted its first positive reading in seven months, coming in at 1.2.
Monthly data for this indicator only dates back to 2004, so it is difficult to see the full potential of this indicator without several business cycles of data. Nevertheless, it is an interesting and important regional manufacturing indicator. The Dallas Fed on the TMOS importance:
Texas is important to the nation’s manufacturing output. The state produced $159 billion in manufactured goods in 2008, roughly 9.5 percent of the country’s manufacturing output. Texas ranks second behind California in factory production and first as an exporter of manufactured goods.
Texas turns out a large share of the country’s production of petroleum and coal products, reflecting the significance of the region’s refining industry. Texas also produces over 10 percent of the nation’s computer and electronics products and nonmetallic mineral products, such as brick, glass and cement.
Here is a snapshot of the complete TMOS.
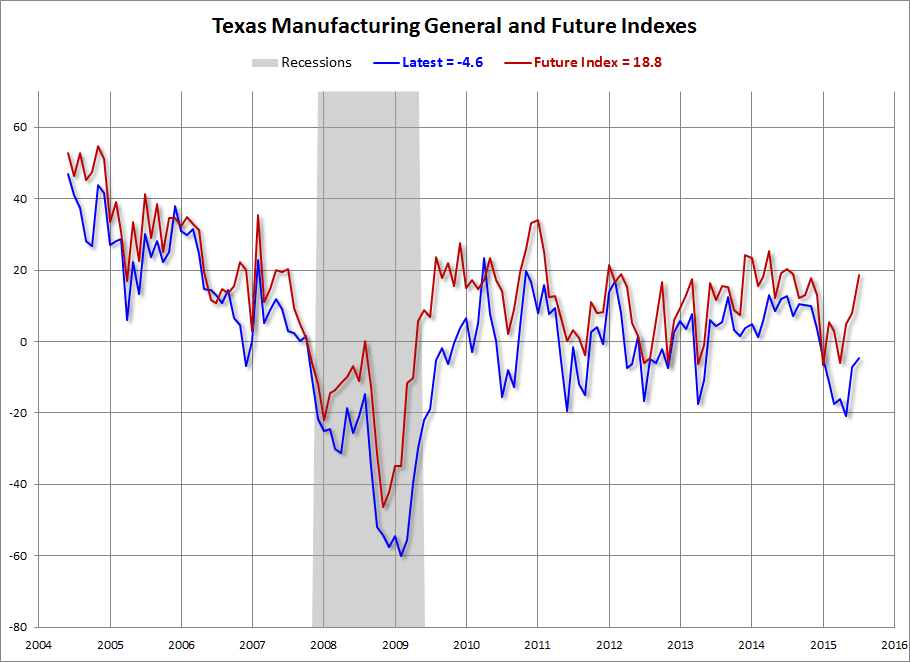
The next chart is an overlay of the General Index and the Future Outlook Index — the outlook six months ahead.
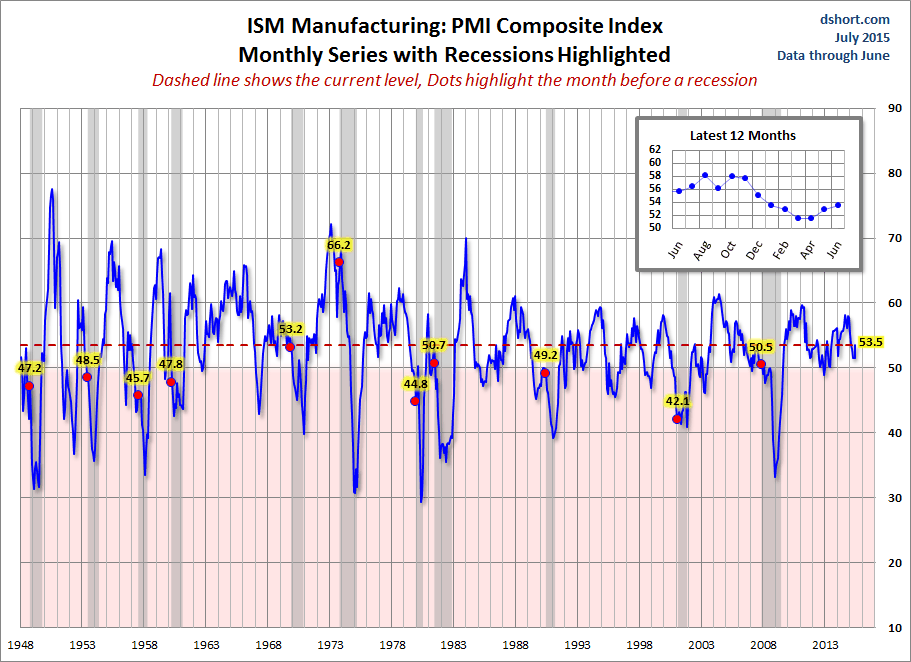
For comparison, here is the latest ISM Manufacturing survey.
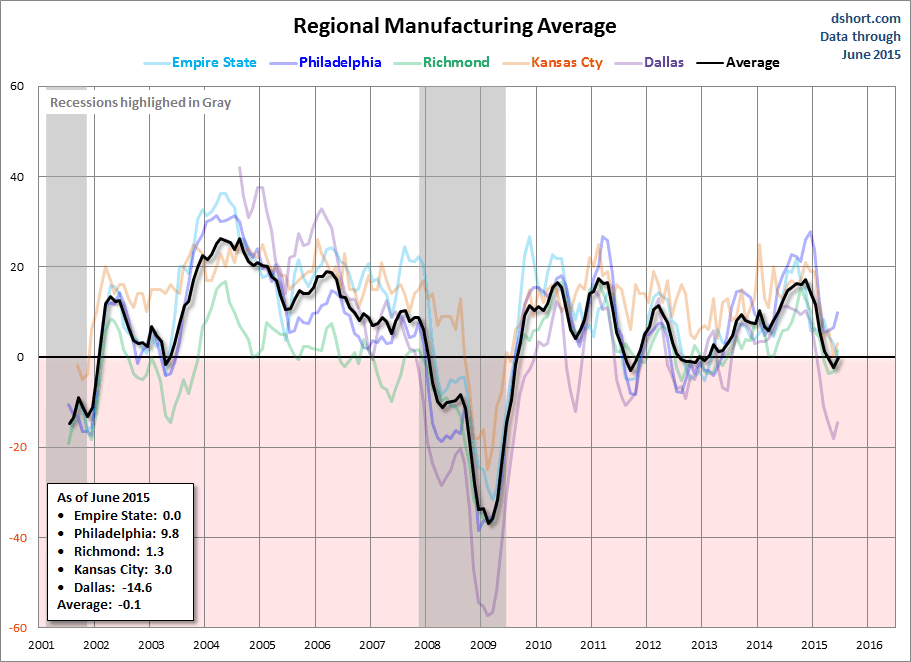
Let's compare all five Regional Manufacturing indicators. Here is a three-month moving average overlay of each since 2001 (updated after the last monthly Regional update, which is Richmond at the end of the month).
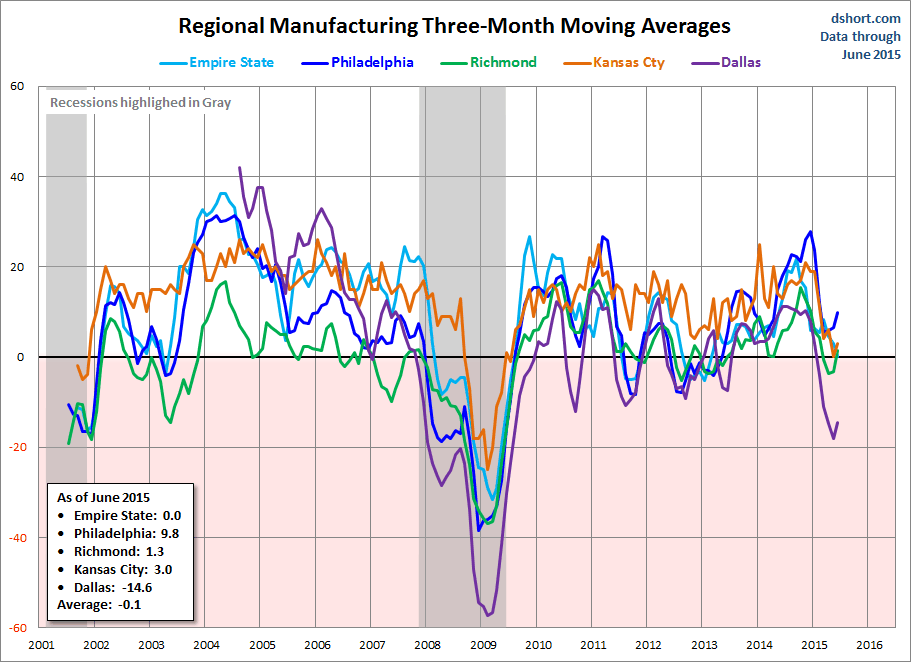
Here is the same chart including the average of the five. Readers will notice the range in expansion and contraction between all regions - this averages out to approximately zero for the average, which is flat and neither expanding nor contracting.
Here are the remaining four monthly manufacturing indicators that we track:
Kansas City Manufacturing Survey
Empire State Manufacturing Survey
Fifth District Manufacturing Survey (Richmond)
Philadelphia Fed Manufacturing Business Outlook Survey
Here is a link to the Regional Fed Manufacturing Overview with the overlay charts.
