
European Session
 EUR/USD Hour Chart" title="EUR/USD Hour Chart" width="474" height="242">
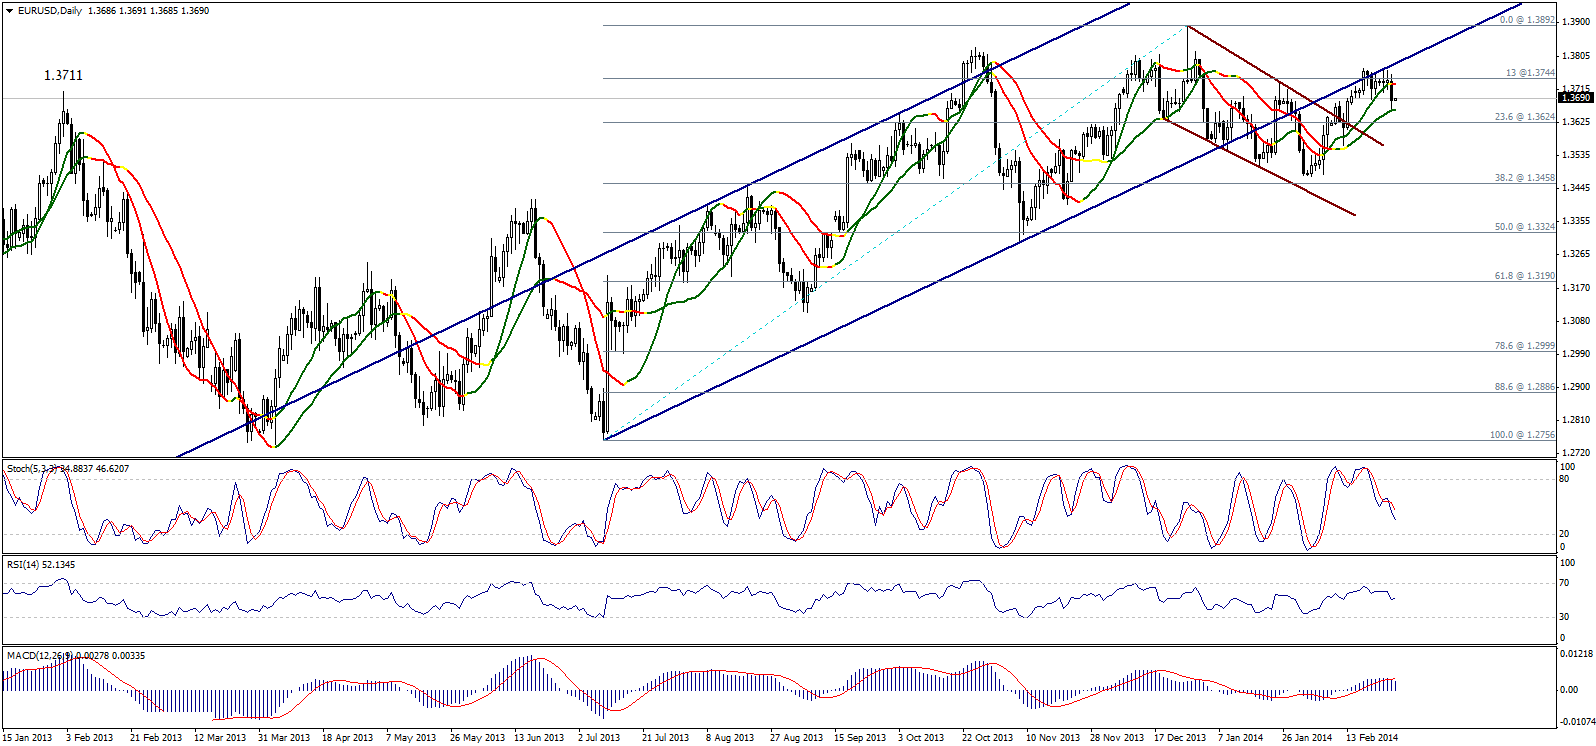
The pair dropped yesterday breaking 1.3680 which is negative and weakens the possibilities of trading again within the ascending channel. But levels 1.3620 are still valid till now, therefore we cannot move to negativity.
In fact, Linear Regression Indicator 34 is negative but Linear Regression Indicator 55 still supports the pair as it managed to stop the bearish extension. Therefore, we prefer to remain neutral waiting for new confirmation signals.
 EUR/USD S&R Chart" title="EUR/USD S&R Chart" width="474" height="242">
 GBP/USD Hour Chart" title="GBP/USD Hour Chart" width="474" height="242">
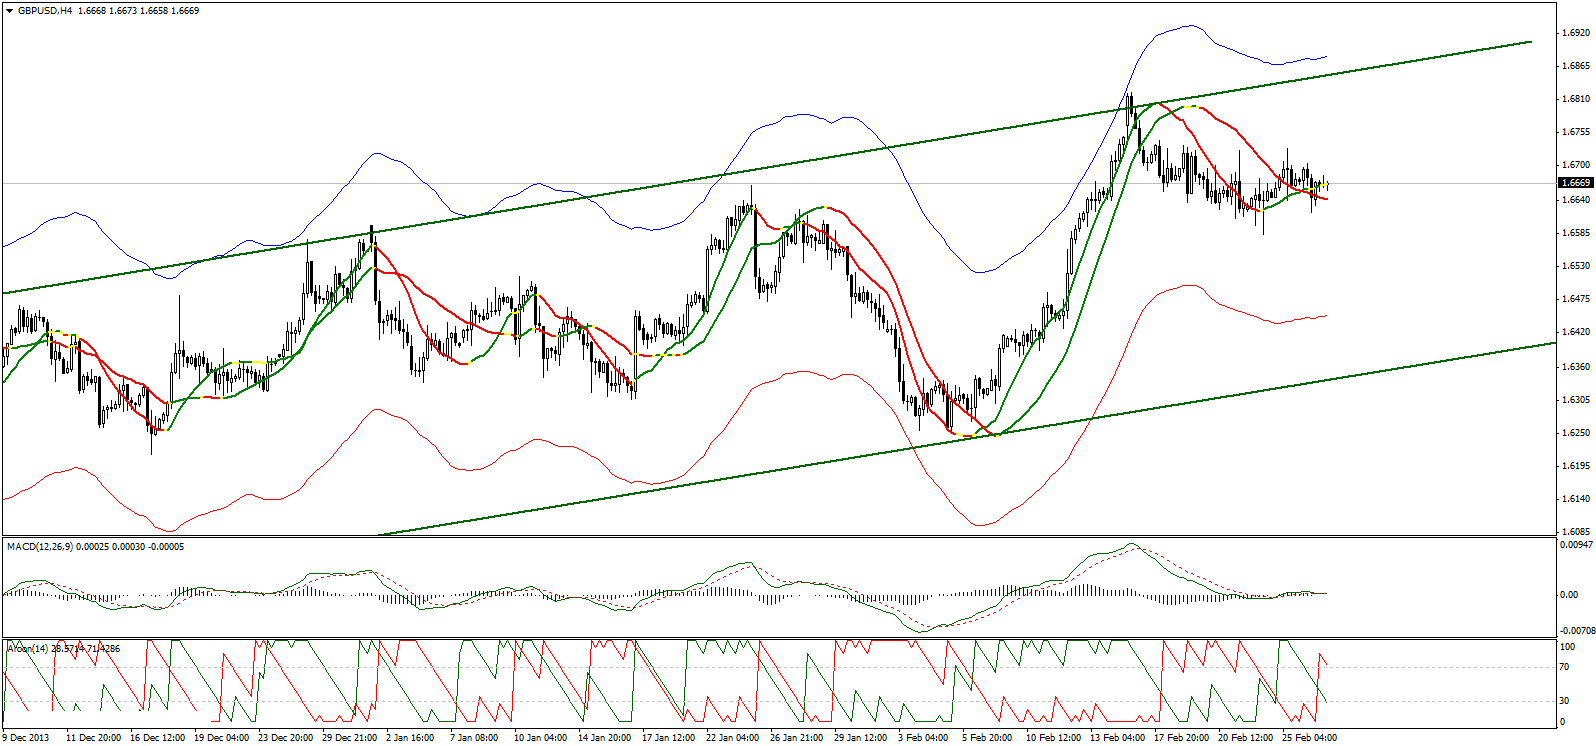
The pair is still stable above Linear Regression Indicators keeping the positive possibility. But AROON Indicator is showing that the upside move is weakening, while MACD is neutral close to line zero.
The possibility of new bullish attempts depends on stability above 1.6600, whereas stabilizing above the referred to level will trigger a bullish wave where the pair could breach the resistance level 1.6740.
On the other hand, breaking 1.6580 will fail the positive outlook and deapens the bearish correction.

 USD/JPY Hour Chart" title="USD/JPY Hour Chart" width="474" height="242">
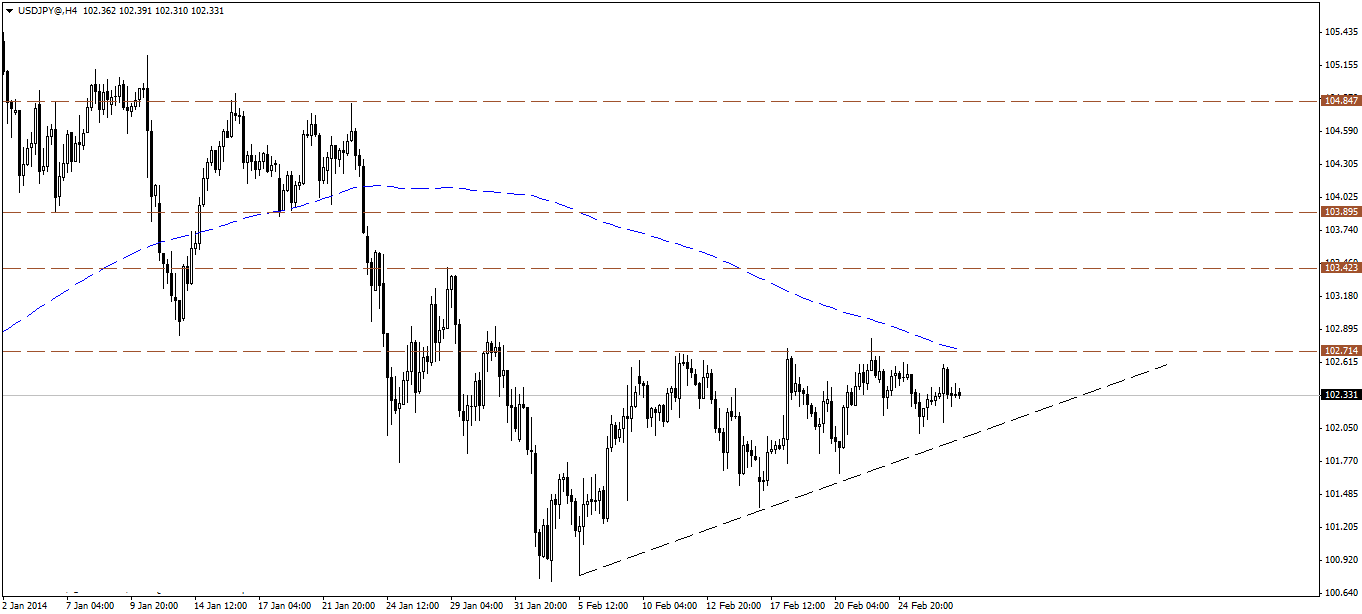
The USD/JPY remains within the relatively tight trading range, above the main ascending support for the correctional wave, and below the main horizontal resistance at 102.70, a breakout of this region is necessary to confirm the next potential move. However, due to the series of the higher lows, we maintain our bullish bias.

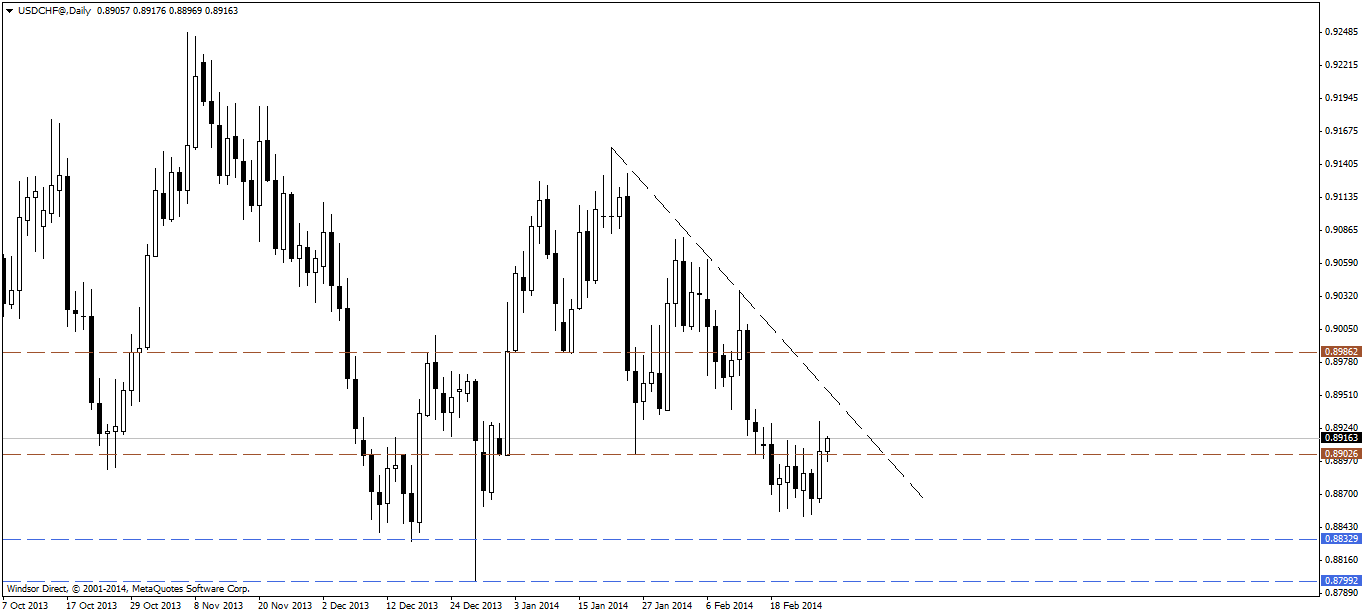 USD/CHF Daily Chart" title="USD/CHF Daily Chart" width="474" height="242">
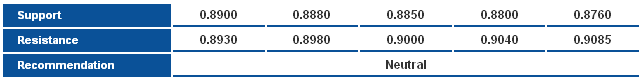
The USD/CHF breaks above 0.8900 level, threatening for more bullish bias, however price is facing the main descending resistance for the bearish wave, accordingly, at the current levels we prefer to move to the sidelines, awaiting a confirmation signal.
 USD/CHF S&R Chart" title="USD/CHF S&R Chart" width="474" height="242">
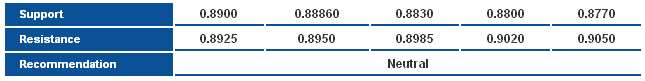
 USD/CAD Daily Chart" title="USD/CAD Daily Chart" width="474" height="242">
The USD/CAD moved higher but remains below the recent highs and resistance area around 1.1200 level, and that keeps the bearish correctional scenario valid. However, we prefer to wait for more confirmation over the lower time intervals to signal a move lower.

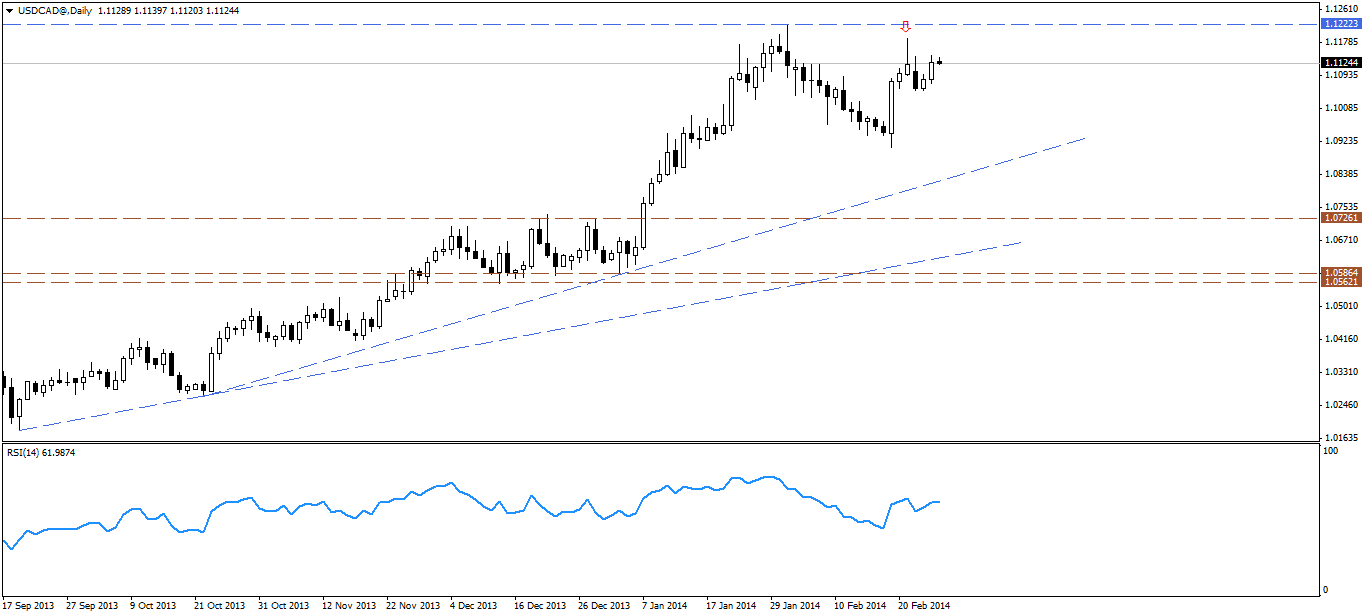
 AUD/USD Daily Chart" title="AUD/USD Daily Chart" width="474" height="242">
The AUD/USD retreated sharply, negating the bullish scenario, as price retest the support level a at 50-days SMA and horizontal support at 0.8900 areas. Due to the strong bearish momentum, we prefer to move to the sidelines, as a break below 0.9000 may signal more downside.
 AUD/USD S&R Chart" title="AUD/USD S&R Chart" width="474" height="242">
 NZD/USD Hourly Chart" title="NZD/USD Hourly Chart" width="474" height="242">
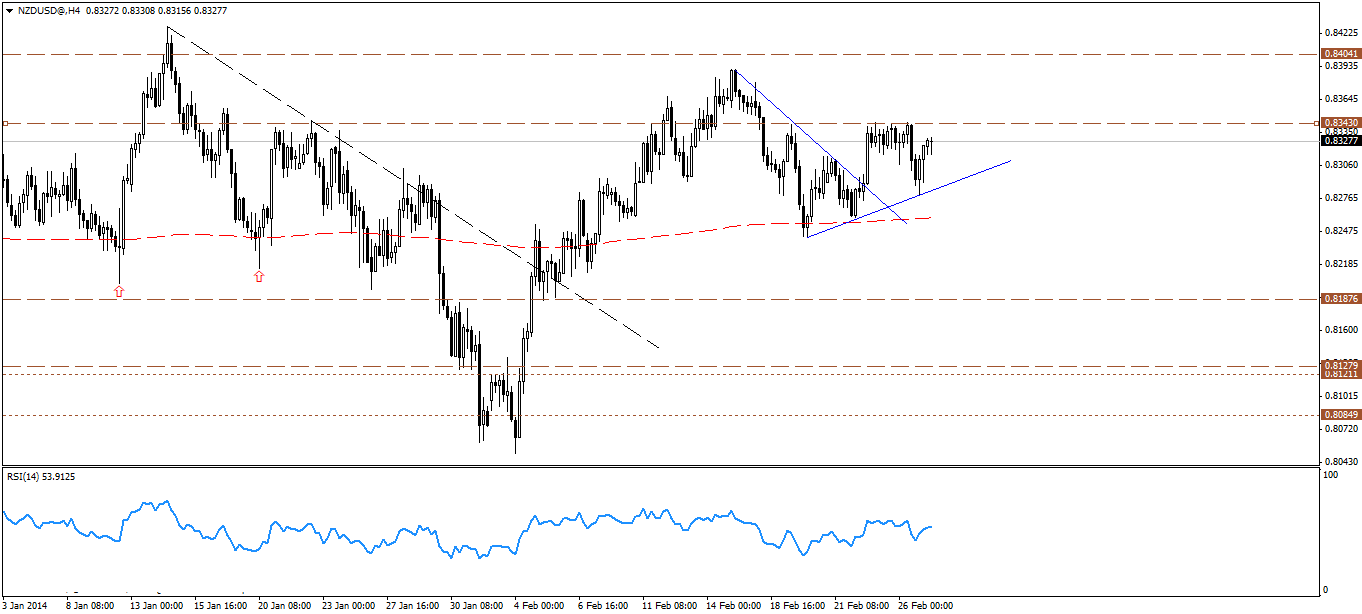
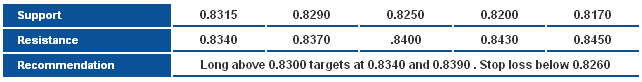
After dipping lower, the NZD/USD is rebounding again, approaching the recent key resistance round 0.8340 level, where a break above the latter should signal more upside, targeting 0.8400 areas and higher. Overall, we maintain our bullish bias for the pair.
 NZD/USD S&R Chart" title="NZD/USD S&R Chart" width="474" height="242">