
EUR/USD: European SessionEUR/USD" title="EUR/USD" src="https://d1-invdn-com.akamaized.net/content/pic2914a8a985402745e0ac03749ab96c5d.png" height="undefined" width="undefined" />
The pair dropped yesterday in an attempt to close the price gap that started at the beginning of this week. As shown on graph, the pair is stale above 23.6% correction at 1.3290 and above Linear Regression Indicators. Therefore, the bullish possibility is still valid and trading above the referred to level caused a bullish rally.
The trading range for today is among the key support at 1.3205 and key resistance at 1.3450.
The general trend over short term basis is sideways targeting 1.2775 as far as 1.3600 is daily-closing.

GBP/USD GBP/USD" border="0" height="746" width="1596" />
The pair dropped yesterday but remained limited above 1.5875 keeping the possibility of an upside move in an attempt to test the technical and psychological levels around 1.6005. Linear Regression Indicators support our positive expectations, but stability below 1.5875 might lead to responding to the overbought signals showing on momentum indicators.
The trading range for today is among the key support at 1.5770 and key resistance at 1.6055.
The general trend over short term basis is to the upside as far as areas of 1.5100 remains intact targeting 1.6010.

USD/JPY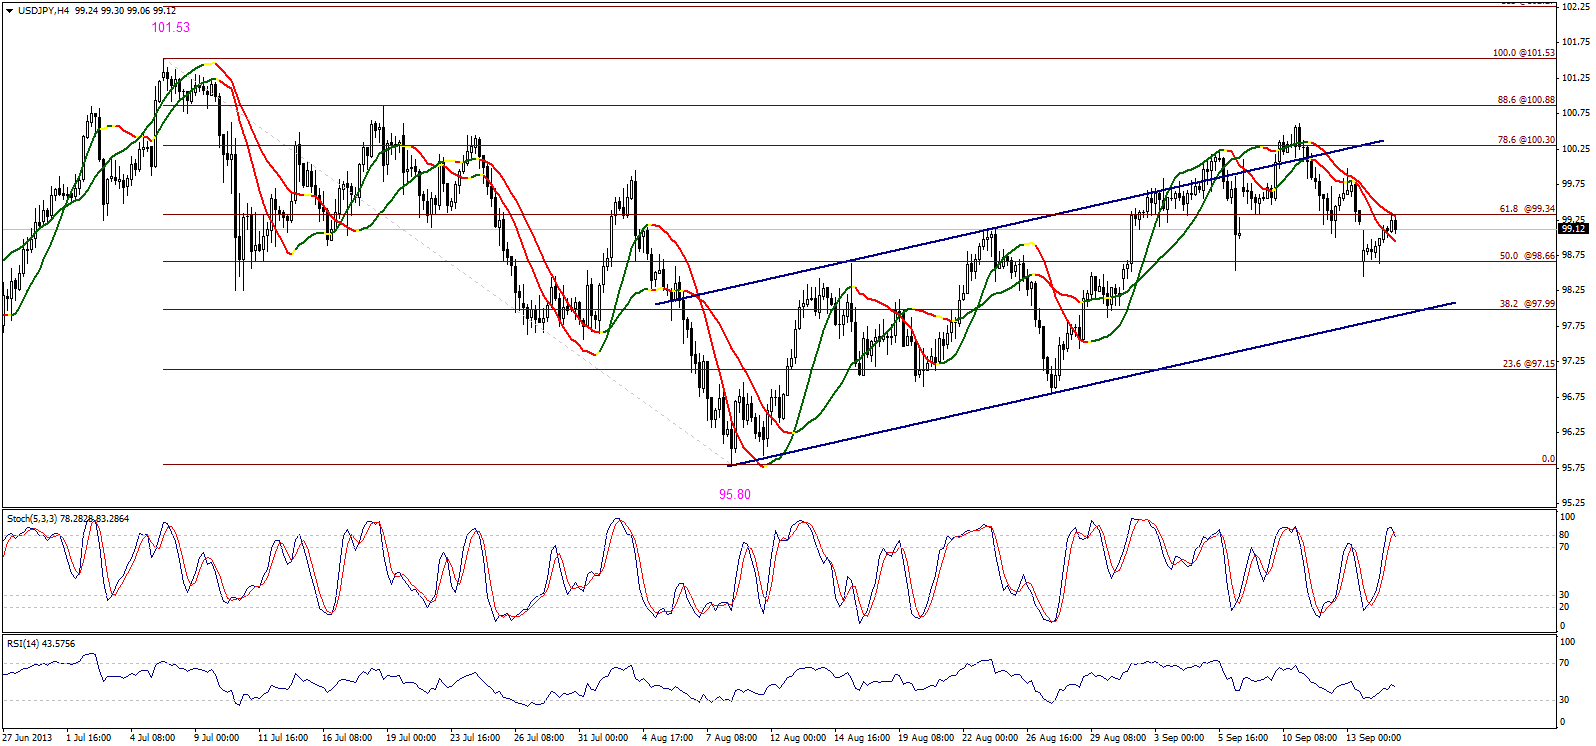 USD/JPY" border="0" height="746" width="1596" />
The pair closed the price gap that started this week and remained stable below a 61.8% correction at 99.35. Linear Regression Indicator 55 represents resistance and Stochastic is showing negative signals. We think that the downside move might return and we might see a new attempt to break 50% correction at 98.65 today.
The trading range for today is among key support at 98.00 and key resistance at 100.30.
The general trend over short term basis is to the downside as far as areas of 103.50 remain intact targeting 93.50.

USD/CHF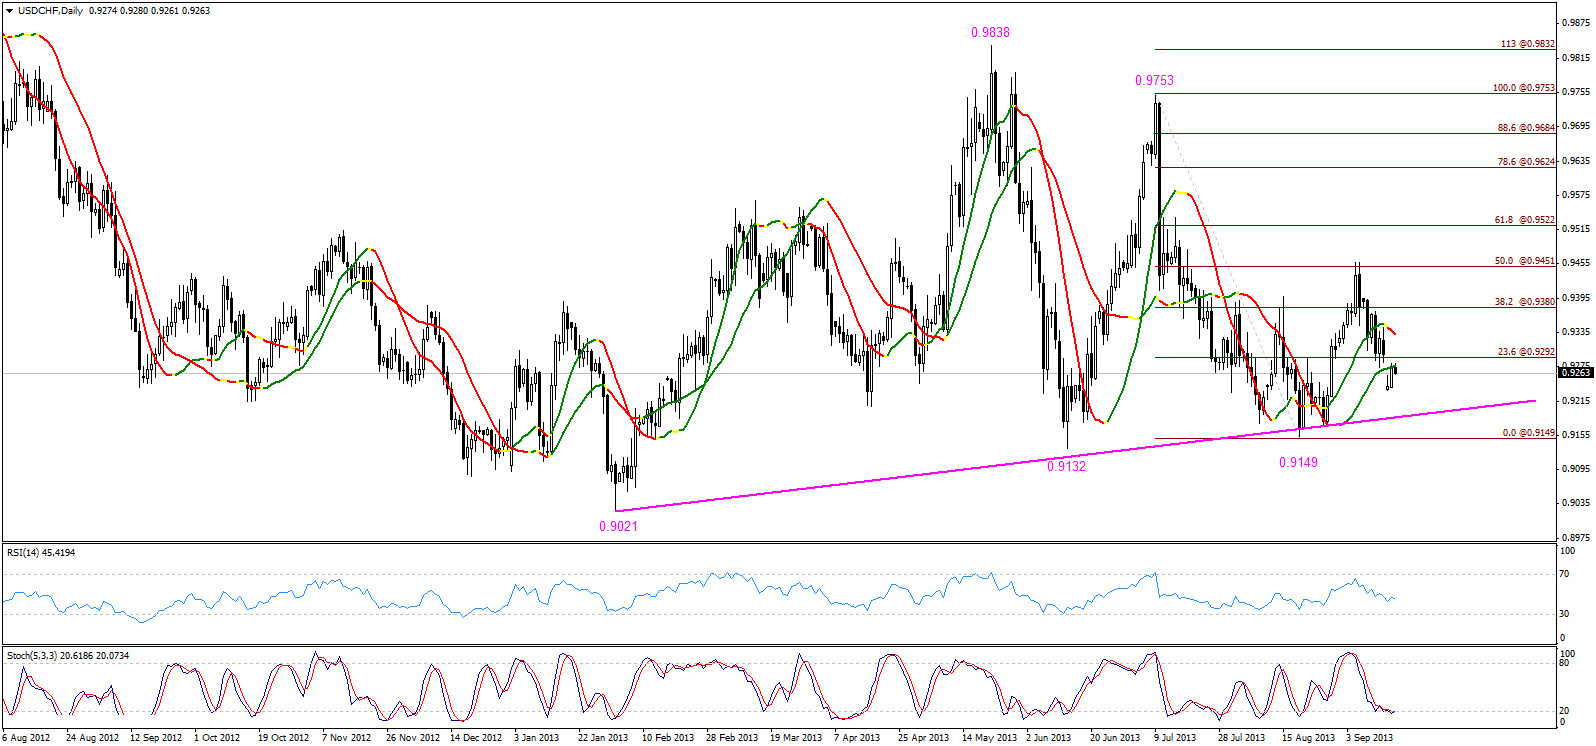 USD/CHF" border="0" height="746" width="1596" />
The pair failed to close the price gap of this week due to Linear Regression Indicator 55 that halted the bullish rally, as the pair is also stable below 23.6% correction. Therefore, the possibility of a downside move is valid in the European session today, but the pair has to break the bullish key support level residing at 0.9185 shown on graph to prove extending bearishness.
The trading range for today is among key support at 0.9125 and key resistance at 0.9320.
The general trend over short term basis is to the downside stable at levels 0.9775 targeting 0.8860
.
USD/CAD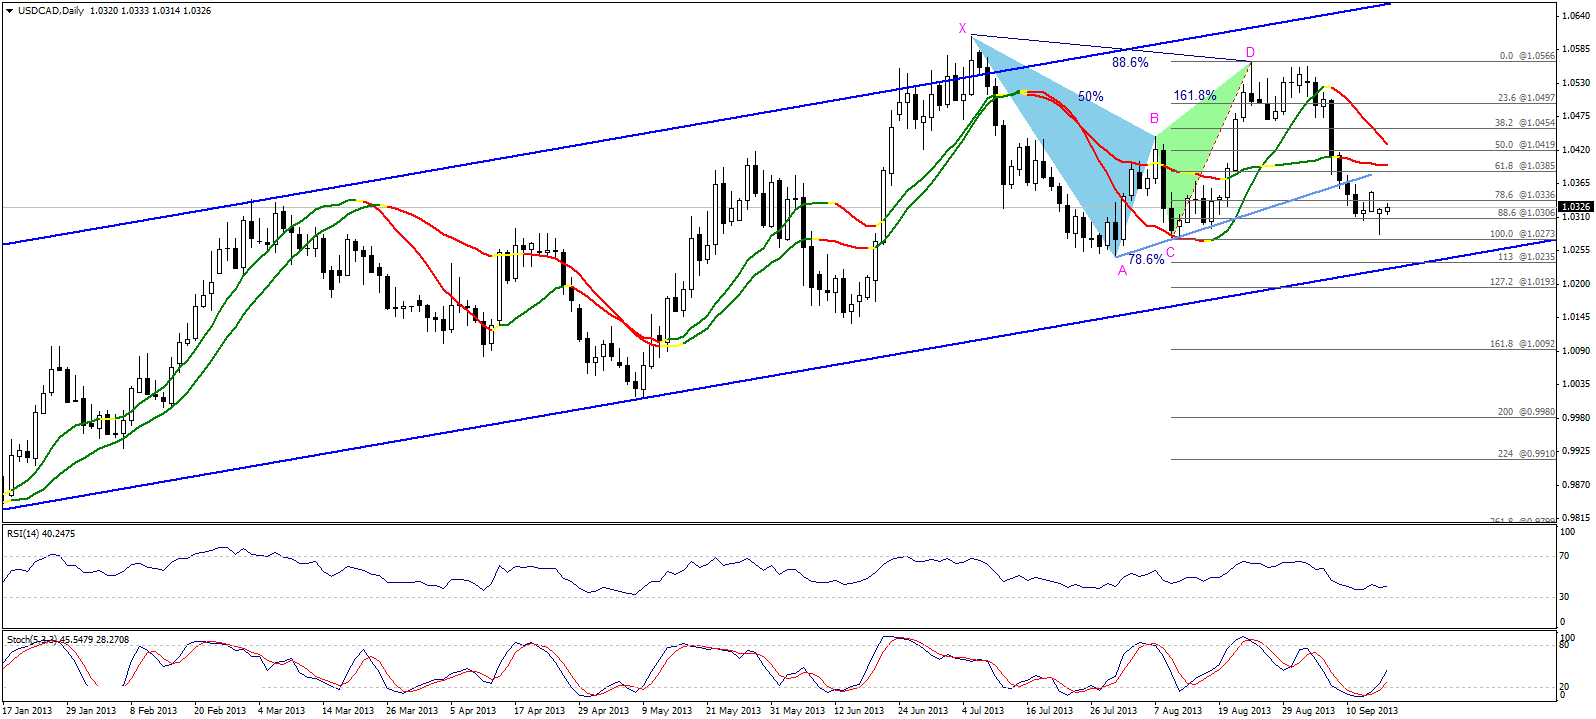 USD/CAD" border="0" height="719" width="1596" />
The pair moved to the upside indicating a contradiction between technical traders opinions. The bearish harmonic Bat Pattern’s effect isn’t over yet; on the other hand the pair approached the key support level of the medium-term ascending channel. The pair has to trade again above 1.0385 to prove the Bat Pattern’s affect, while it has to return below 1.0305 levels to prove the opposite. We prefer to remain neutral in this report since the pair is currently stable between these levels.
The trading range for today is between the key support at 1.0235 and the key resistance at 1.0385.
The general trend over short term basis is to the upside with steady daily closing above levels 1.0100 targeting 1.0775.

AUD/USD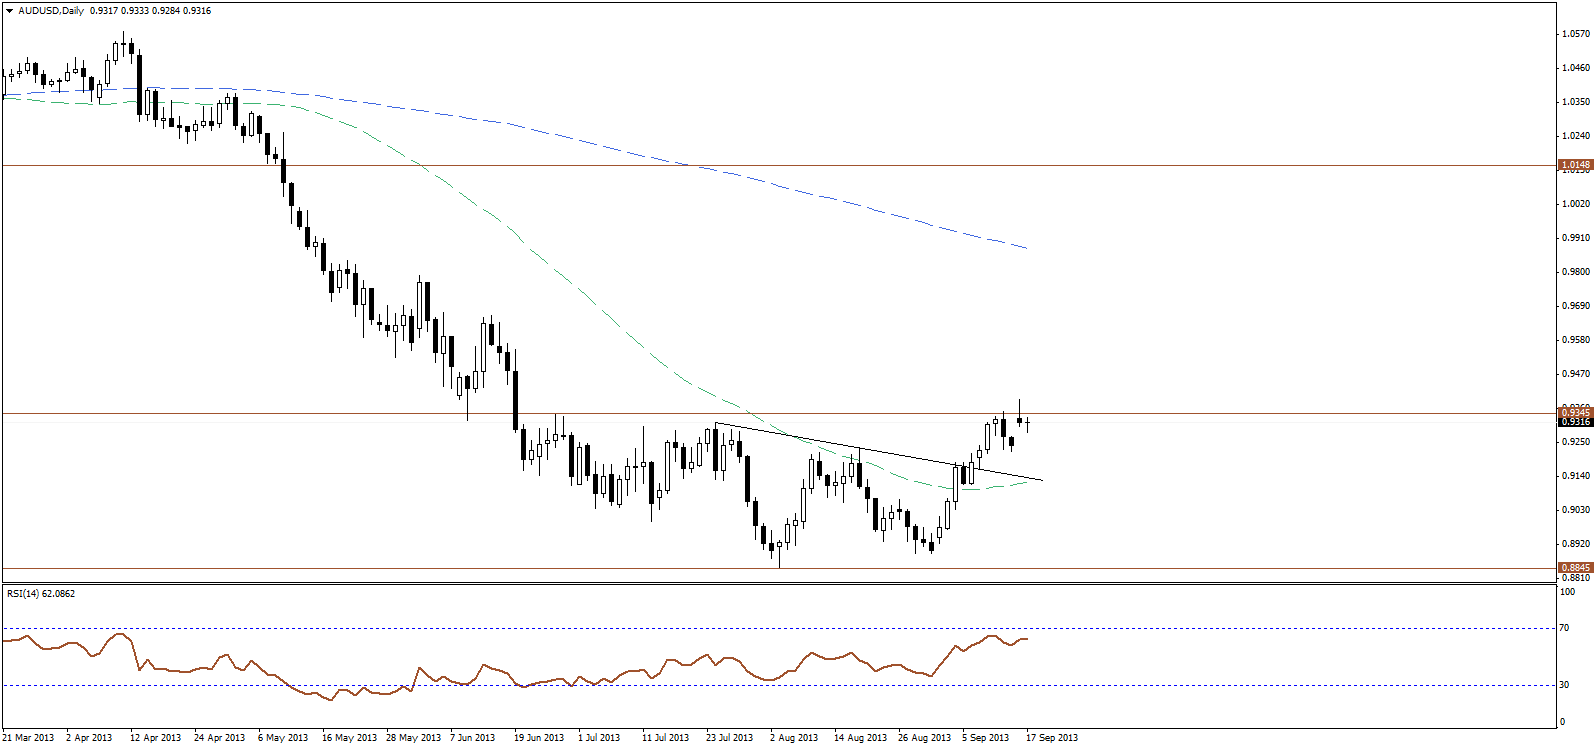 AUD/CAD" border="0" height="746" width="1596" />
The pair retreated to close trading session back below 0.9345 resistance, and thus failed to confirm the bullish breakout, forming a bearish shooting star candlestick formation, which warns for a possible downside reversal. We prefer to stand on the sidelines for now, awaiting further confirmation.

NZD/USD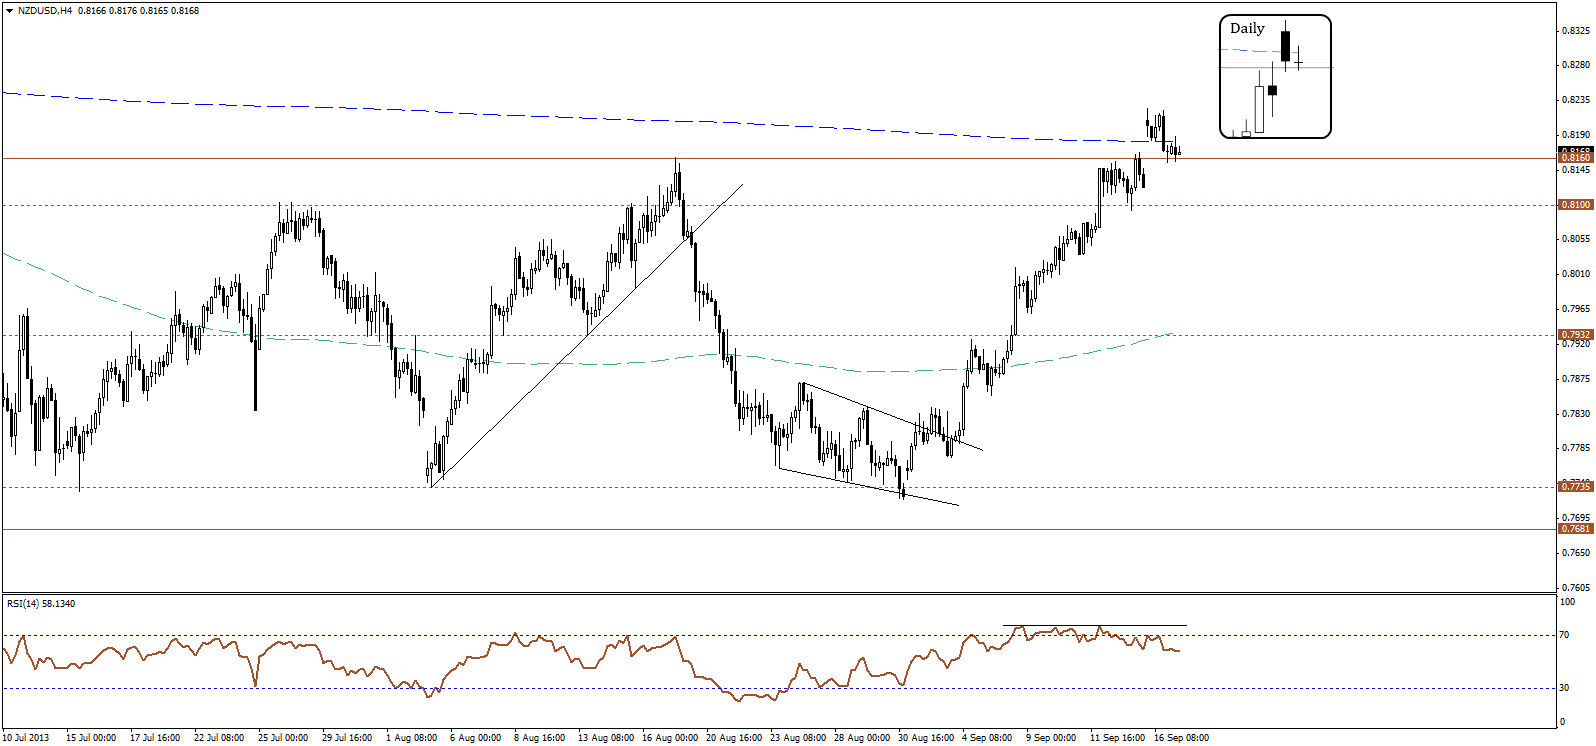 NZD/USD" border="0" height="746" width="1596" />
The NZD/USD failed to close the trading session above the 200-days SMA, as price retreated to form a bearish candlestick following the week opening gap. Meanwhile, the RSI remains weak over the four-hour time interval as momentum fails to confirm the rally and is moving lower. Accordingly, we move to the sidelines, waiting for a confirmation of bearish reversal or the continuation of rally.
