
EUR/USD - Weekly Report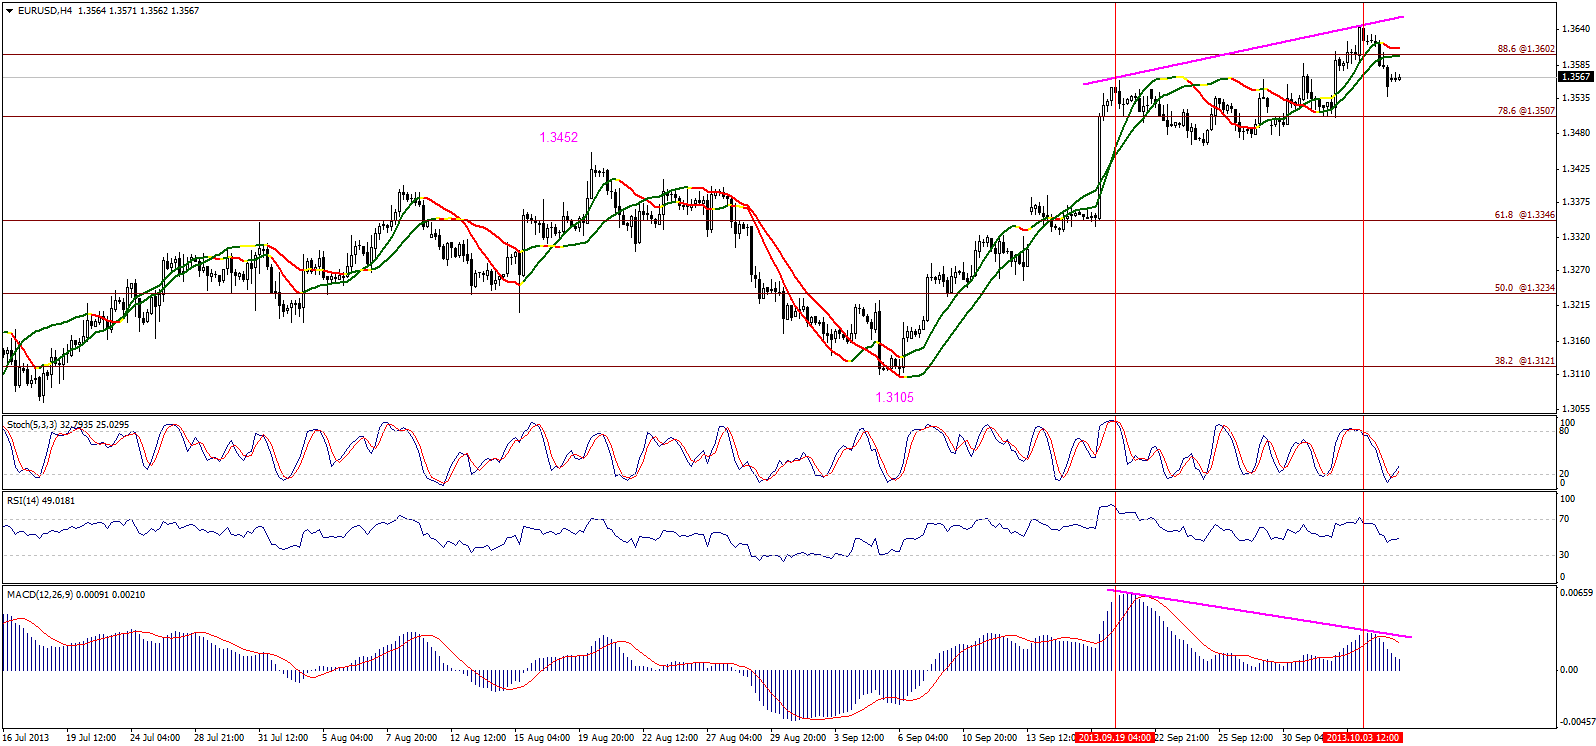 EUR/USD" border="0" height="746" width="1596" />
With the beginning of this week, we notice the negative divergence on the MACD accompanied by trading below 1.3605 as shown on four-hour graph. Therefore, we expect a bearish correctional wave. The downside wave relies on breaking 1.3505 levels represented in 78.6% correction, as it might extend bearishness.
The trading range for this week is among the key support at 1.3345 and key resistance at 1.3715.
The general trend over short term basis is sideways with daily closing between 1.2775 and 1.3600.EUR/USD S&R" title="EUR/USD S&R" src="https://d1-invdn-com.akamaized.net/content/piceab163820171ae80cbb1be0108cc97c3.png" height="117" width="632" />
GBP/USDGBP/USD Daily Chart" title="GBP/USD Daily Chart" src="https://d1-invdn-com.akamaized.net/content/pic6993b73430aa18b07da7d0bc5685c65e.png" height="117" width="632" />
RSI offers negative divergence accompanied by the breakout below the short-term ascending support in addition to the formation of a long bearish candle. All these circumstances force us to expect the pair to extend the downside move this week, but breaking 1.6010 is significant to support this outlook. Breaching 1.6170 levels and stabilizing above it might fail the negative outlook for a bearish correction possibility.
The trading range for this week is among the key support at 1.5760 and key resistance at 1.6340.
The general trend over short term basis is to the upside as far as areas of 1.5280 remains intact targeting 1.6540.GBP/USD S&R" title="GBP/USD S&R" src="https://d1-invdn-com.akamaized.net/content/pic574b9715906c8dfa339c7a3e2e230149.png" height="115" width="632" />
USD/JPYUSD/JPY Hourly Chart" title="USD/JPY Hourly Chart" src="https://d1-invdn-com.akamaized.net/content/pica954fcf46b98eac926cb8d04fa7ffbec.png" height="115" width="632" />
The downside move extended last week and the pair is currently stable below 61.8% correction at 97.65. Stability below this level might trigger an attempt to break 78.6% correction residing at 96.05. Linear Regression Indicators and Stochastic support the negative possibility. Over weekly basis, breaching 98.20 could trigger a new bullish wave, but we prefer to see the pair stable below 97.65 to keep the negative possibility.
The trading range for this week is among key support at 95.45 and key resistance at 98.80.
The general trend over short term basis is to the downside as far as areas of 103.50 remain intact targeting 93.50.USD/JPY S&R" title="USD/JPY S&R" src="https://d1-invdn-com.akamaized.net/content/pic15e9a181a45b880cd1e38c198f061a70.png" height="115" width="632" />
USD/CHFUSD/CHF Daily Chart" title="USD/CHF Daily Chart" src="https://d1-invdn-com.akamaized.net/content/pic1ca3a63a03e05a5488dad2cbe4ccd4e1.png" height="115" width="632" />
The pair moved to the upside last Friday and failed to stabilize below the psychological barrier 0.9000. The upside move remains limited till now below 0.9065 represented in 127.2% Fibonacci, and Linear Regression Indicators are still negative. Therefore, our weekly outlook is neutral for now waiting for new confirmations.
The trading range for this week is among key support at 0.8840 and key resistance at 0.9225.
The general trend over short term basis is to the downside targeting 0.8860 as far as 0.9775 remains intact.USD/CHF S&R" title="USD/CHF S&R" src="https://d1-invdn-com.akamaized.net/content/pic882cdcb11d70aadbf5086d66a55ed041.png" height="115" width="632" />
USD/CADUSD/CAD Daily Chart" title="USD/CAD Daily Chart" src="https://d1-invdn-com.akamaized.net/content/picc5e2921f930b5e18849253b096073274.png" height="115" width="632" />+The pair is currently stabilizing above Linear Regression Indicator 34, whereas the upside move finally managed to consolidate above the referred to level. Stabilizing above 1.0235 will be considered positive this week and might trigger an attempt to test 1.0380 levels. If the pair stabilizes above the latter represented in 23.6% correction and Linear Regression Indicator 55, we might see a new bullish wave.
The trading range for this week is between the key support at 1.0200 and the key resistance at 1.0500.
The general trend over short term basis is to the upside with steady daily closing above 1.0100 targeting 1.0775.USD/CAD S&R" title="USD/CAD S&R" src="https://d1-invdn-com.akamaized.net/content/picf535760088e95416a863e5697be184e6.png" height="115" width="632" />
AUD/USDAUD/USD Daily Chart" title="AUD/USD Daily Chart" src="https://d1-invdn-com.akamaized.net/content/pic727c02b541f701ec586c43b218b5df5c.png" height="115" width="632" />
The price is swinging above the broken resistance area around 0.9300, as shown on the daily chart above, the breakout above 0.9300 has completed a short term bottom, and favors the bullish scenario within the upcoming period(weeks). However, over intraday basis, the pair has broken below 0.9420 intraday support, and a minor ascending trend line over the hourly chart, accordingly, we look for further downside pressure during the day, but maintain our overall bullish view.AUD/USD S&R" title="AUD/USD S&R" src="https://d1-invdn-com.akamaized.net/content/pic863d88673070ede83481720837cb9d07.png" height="115" width="632" />
NZD/USDNZD/USD Hourly Chart" title="NZD/USD Hourly Chart" src="https://d1-invdn-com.akamaized.net/content/pic03c66f72ccd7437f804e4b13511c216e.png" height="115" width="632" />
The pair failed for the third time to break and hold above 0.8340 resistance level, pushing back lower, a break back below 0.8275 now will signal further intraday downside bias. However, over short term and the week, the bullish scenario remains favored so long as 0.8160 is support.NZD/USD S&R" title="NZD/USD S&R" src="https://d1-invdn-com.akamaized.net/content/pic035ada4ea45c410ac1ecb1b624df823c.png" height="115" width="632" />