
EUR/USD
 EUR/USD" title="EUR/USD" width="700" height="480" />
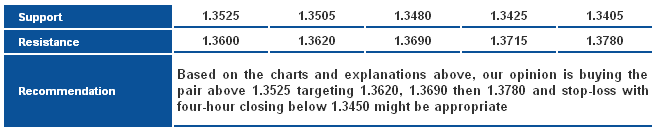
The pair moved to the upside again after stabilizing above 1.3505 levels, as it stabilized today above Linear Regression Indicator 34 and 55. Stability above the referred to level might push the pair to test 1.3620 areas and perhaps extend the move toward 1.3695 levels. We still think that the upside move might extend with intraday stability above 1.3505 today.
The trading range for today is among the key support at 1.3405 and key resistance at 1.3780.
The general trend over short term basis is negative targeting 1.1865 as far as areas of 1.3550 remains intact.
 EUR/USD_S&R" title="EUR/USD_S&R" width="657" height="131" />
GBP/USD
 GBP/USD" title="GBP/USD" width="700" height="480" />
The pair rose sharply yesterday after consolidating above 1.5760 levels weakening the downside move. Meanwhile, the pair is still stable below 1.5825 levels leaving the possibility of extending positivity uncertain. Therefore, we remain neutral today to see how the pair will react with the referred to levels especially with conflict between the negativity on Linear Regression Indicators and positivity on momentum indicators.
The trading range for today is among key support at 1.5690 and key resistance at 1.5930.
The general trend over short term basis is to the downside targeting 1.6875 as far as areas of 1.4225 remains intact.
 GBP/USD_S&R" title="GBP/USD_S&R" width="657" height="99" />
USD/JPY
 USD/JPY" title="USD/JPY" width="700" height="480" />
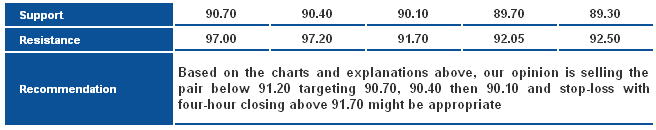
The pair moved closer yesterday to the significant resistance level at 91.70, currently trending lower. Linear Regression Indicators 34 is negatively biased and RSI offered a negative crossover signaling possible bearish correction. We should keep in mind that trading near 91.70 levels keep the Risk/Reward isn’t appropriate here so we suggest a downside correctional that requires areas of 91.70 to remain intact.
The trading range for today is among key support at 89.00 and key resistance at 92.50.
The general trend over short term basis is to the upside targeting 91.70 as far as areas of 83.40 remain intact.
 USD/JPY_S&R" title="USD/JPY_S&R" width="656" height="130" />
USD/CHF
 USD/CHF" title="USD/CHF" width="700" height="480" />
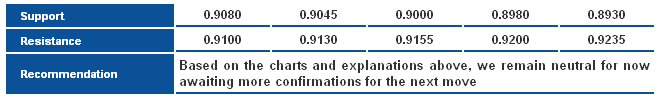
The pair slumped yesterday to return below the key descending resistance as shown on the graph. Linear Regression Indicators are trending to the downside yet Stochastic offers oversold signals forcing us to remain neutral for now.
The trading range for today is among key support at 0.8900 and key resistance at 0.9200.
The general trend over short term basis is to the downside stable at levels 0.9775 targeting 0.8860.
 USD/CHF_S&R" title="USD/CHF_S&R" width="659" height="99" />
USD/CAD
 USD/CAD" title="USD/CAD" width="700" height="480" />
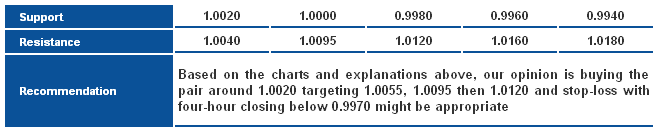
The pair managed to benefit from stability above 1.0000 levels to try to move to the upside. Despite the negativity on Stochastic, Linear Regression Indicators are positive in addition to stability above the mentioned psychological barrier making us expect a new attempt to the upside today. Breaking 0.9960 levels might fail the intraday upside move.
The trading range for today is between the key support at 0.9900 and the key resistance at 1.0205.
The general trend over short term basis is to the downside below levels 1.0125 targeting 0.9400.
 USD/CAD_S&R" title="USD/CAD_S&R" width="658" height="133" />
AUD/USD
 AUD/USD" title="AUD/USD" width="700" height="480" />
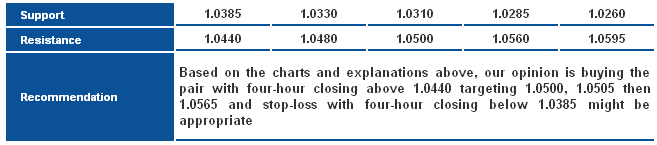
The pair is still stable above 1.0385 levels with four-hour closing, leaving the possibility of a new attempt to the upside. Stability above the mentioned level might support another upside to stabilize above 1.0430 and 1.0440 levels, in that case the bullish move might return. Stochastic is showing oversold signals.
The trading range for today is among key support at 1.0310 and key resistance at 1.0565.
The general trend over short term basis is to the downside below levels 1.0710 targeting 0.9400.
 AUD/USD_S&R" title="AUD/USD_S&R" width="657" height="145" />
NZD/USD
 NZD/USD" title="NZD/USD" width="700" height="480" />
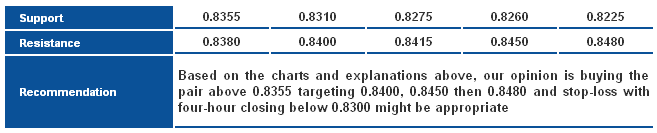
The pair is still stable above the upside key support level forcing us to prefer a new attempt to the upside. Linear Regression Indicator 34 and 55 prevents the extension of the upside move, while the minor support at levels 0.8450 shown in pink represents an important barrier in front of extending the bullish move. Since the pair is stable above 0.8275 levels we expect to see other attempts to the upside and breaching the referred to levels.
The trading range for today might be among key support at 0.8225 and key resistance at 0.8480.
The general trend over short term basis is to the upside with steady daily closing above0.8130 targeting 0.8845.
 NZD/USD_S&R" title="NZD/USD_S&R" width="657" height="133" />
GBP/JPY
 GBP/JPY" title="GBP/JPY" width="700" height="480" />
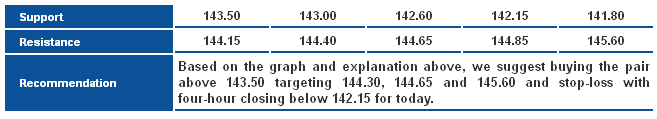
Positive circumstances maintain control over the pair's movement and it is now stable above the rising channel's key support. Still the pair should breach 144.30 for positivity to extend and enter a new ascending wave in order to cancel the momentum's negative bias as shown on Stochastic. In general, since trading is stable above 142.60, we keep our positive outlook.
The trading range expected today is between the key support at 140.45 and the key resistance at 146.15.
The short-term trend is downside targeting 112.00 and 150.00.
 GBP/JPY_S&R" title="GBP/JPY_S&R" width="657" height="119" />
EUR/JPY
 EUR/JPY" title="EUR/JPY" width="700" height="480" />
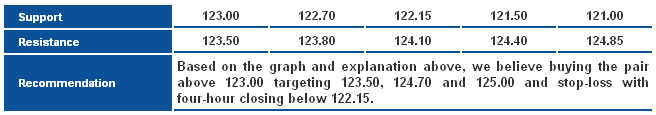
The pair is trading in levels above 122.15 up until now since it was breached; stability above this level is enough cause to help us predict further uptrend. Linear Regression Indicators are positive despite the pair's proximity to the bullish trend's key resistance and negative signals of momentum indicators. This supports forecasts of continued positivity and attempts to rise farther than the resistance shown on the graph.
The trading range expected for today is between the key support at 121.15 and the key resistance at 125.00.
The short-term trend is upside targeting 128.75 as far as 109.45 remains intact.
 EUR/JPY_S&R" title="EUR/JPY_S&R" width="656" height="115" />
EUR/GBP
 EUR/JPY_S&R" title="EUR/JPY_S&R" width="700" height="480" />
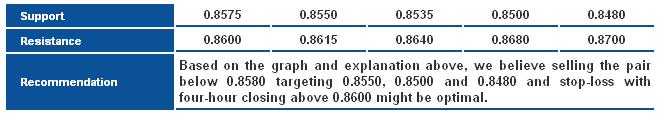
Failure to reside above 0.8600 with four-hour closing maintains possibilities of a downside correction occurrence. However to support forecasts of correction, the pair must consolidate below 0.8375. Momentum indicators reflect the pair's need for confirming a correction, and stability below Linear Regression Indicators helps confirm that.
The trading range expected for today is between the key support at 0.8440 and the key resistance at 0.8680.
The short-term trend is upside targeting 1.0370 provided that 0.7785.
 EUR/GBP_S&R" title="EUR/GBP_S&R" width="657" height="115" />
EUR/USD" title="EUR/USD" width="700" height="480" />The pair moved to the upside again after stabilizing above 1.3505 levels, as it stabilized today above Linear Regression Indicator 34 and 55. Stability above the referred to level might push the pair to test 1.3620 areas and perhaps extend the move toward 1.3695 levels. We still think that the upside move might extend with intraday stability above 1.3505 today.
The trading range for today is among the key support at 1.3405 and key resistance at 1.3780.
The general trend over short term basis is negative targeting 1.1865 as far as areas of 1.3550 remains intact.
EUR/USD_S&R" title="EUR/USD_S&R" width="657" height="131" />GBP/USD
GBP/USD" title="GBP/USD" width="700" height="480" />The pair rose sharply yesterday after consolidating above 1.5760 levels weakening the downside move. Meanwhile, the pair is still stable below 1.5825 levels leaving the possibility of extending positivity uncertain. Therefore, we remain neutral today to see how the pair will react with the referred to levels especially with conflict between the negativity on Linear Regression Indicators and positivity on momentum indicators.
The trading range for today is among key support at 1.5690 and key resistance at 1.5930.
The general trend over short term basis is to the downside targeting 1.6875 as far as areas of 1.4225 remains intact.
GBP/USD_S&R" title="GBP/USD_S&R" width="657" height="99" />USD/JPY
USD/JPY" title="USD/JPY" width="700" height="480" />The pair moved closer yesterday to the significant resistance level at 91.70, currently trending lower. Linear Regression Indicators 34 is negatively biased and RSI offered a negative crossover signaling possible bearish correction. We should keep in mind that trading near 91.70 levels keep the Risk/Reward isn’t appropriate here so we suggest a downside correctional that requires areas of 91.70 to remain intact.
The trading range for today is among key support at 89.00 and key resistance at 92.50.
The general trend over short term basis is to the upside targeting 91.70 as far as areas of 83.40 remain intact.
USD/JPY_S&R" title="USD/JPY_S&R" width="656" height="130" />USD/CHF
USD/CHF" title="USD/CHF" width="700" height="480" />The pair slumped yesterday to return below the key descending resistance as shown on the graph. Linear Regression Indicators are trending to the downside yet Stochastic offers oversold signals forcing us to remain neutral for now.
The trading range for today is among key support at 0.8900 and key resistance at 0.9200.
The general trend over short term basis is to the downside stable at levels 0.9775 targeting 0.8860.
USD/CHF_S&R" title="USD/CHF_S&R" width="659" height="99" />USD/CAD
USD/CAD" title="USD/CAD" width="700" height="480" />The pair managed to benefit from stability above 1.0000 levels to try to move to the upside. Despite the negativity on Stochastic, Linear Regression Indicators are positive in addition to stability above the mentioned psychological barrier making us expect a new attempt to the upside today. Breaking 0.9960 levels might fail the intraday upside move.
The trading range for today is between the key support at 0.9900 and the key resistance at 1.0205.
The general trend over short term basis is to the downside below levels 1.0125 targeting 0.9400.
USD/CAD_S&R" title="USD/CAD_S&R" width="658" height="133" />AUD/USD
AUD/USD" title="AUD/USD" width="700" height="480" />The pair is still stable above 1.0385 levels with four-hour closing, leaving the possibility of a new attempt to the upside. Stability above the mentioned level might support another upside to stabilize above 1.0430 and 1.0440 levels, in that case the bullish move might return. Stochastic is showing oversold signals.
The trading range for today is among key support at 1.0310 and key resistance at 1.0565.
The general trend over short term basis is to the downside below levels 1.0710 targeting 0.9400.
AUD/USD_S&R" title="AUD/USD_S&R" width="657" height="145" />NZD/USD
NZD/USD" title="NZD/USD" width="700" height="480" />The pair is still stable above the upside key support level forcing us to prefer a new attempt to the upside. Linear Regression Indicator 34 and 55 prevents the extension of the upside move, while the minor support at levels 0.8450 shown in pink represents an important barrier in front of extending the bullish move. Since the pair is stable above 0.8275 levels we expect to see other attempts to the upside and breaching the referred to levels.
The trading range for today might be among key support at 0.8225 and key resistance at 0.8480.
The general trend over short term basis is to the upside with steady daily closing above0.8130 targeting 0.8845.
NZD/USD_S&R" title="NZD/USD_S&R" width="657" height="133" />GBP/JPY
GBP/JPY" title="GBP/JPY" width="700" height="480" />Positive circumstances maintain control over the pair's movement and it is now stable above the rising channel's key support. Still the pair should breach 144.30 for positivity to extend and enter a new ascending wave in order to cancel the momentum's negative bias as shown on Stochastic. In general, since trading is stable above 142.60, we keep our positive outlook.
The trading range expected today is between the key support at 140.45 and the key resistance at 146.15.
The short-term trend is downside targeting 112.00 and 150.00.
GBP/JPY_S&R" title="GBP/JPY_S&R" width="657" height="119" />EUR/JPY
EUR/JPY" title="EUR/JPY" width="700" height="480" />The pair is trading in levels above 122.15 up until now since it was breached; stability above this level is enough cause to help us predict further uptrend. Linear Regression Indicators are positive despite the pair's proximity to the bullish trend's key resistance and negative signals of momentum indicators. This supports forecasts of continued positivity and attempts to rise farther than the resistance shown on the graph.
The trading range expected for today is between the key support at 121.15 and the key resistance at 125.00.
The short-term trend is upside targeting 128.75 as far as 109.45 remains intact.
EUR/JPY_S&R" title="EUR/JPY_S&R" width="656" height="115" />EUR/GBP
EUR/JPY_S&R" title="EUR/JPY_S&R" width="700" height="480" />Failure to reside above 0.8600 with four-hour closing maintains possibilities of a downside correction occurrence. However to support forecasts of correction, the pair must consolidate below 0.8375. Momentum indicators reflect the pair's need for confirming a correction, and stability below Linear Regression Indicators helps confirm that.
The trading range expected for today is between the key support at 0.8440 and the key resistance at 0.8680.
The short-term trend is upside targeting 1.0370 provided that 0.7785.
EUR/GBP_S&R" title="EUR/GBP_S&R" width="657" height="115" />