
EUR/USDEUR/USD Daily Chart" title="EUR/USD Daily Chart" src="https://d1-invdn-com.akamaized.net/content/picb2bfe41706a07233573c999ebc5afd3f.png" height="746" width="1596">
The pair is still sable above 23.6% correction at 1.3290 and above Linear Regression Indicators. The RSI is trading above line 50 in a bullish bias forcing us to think that the current bullish wave might extend. Of note, breaching 1.3440 and stabilizing above it might trigger a stronger upside wave.
The trading range for today is among the key support at 1.3205 and key resistance at 1.3440.
The general trend over short term basis is sideways targeting 1.2775 as far as 1.3600 is daily-closing.

GBP/USDGBP/USD Daily Chart" title="GBP/USD Daily Chart" src="https://d1-invdn-com.akamaized.net/content/pic2dcb56054d75afca1c51be18181e691b.png" height="746" width="1596">
The pair fluctuated within a tight range yesterday. The weak trading stabilized above 1.5875, whereas the bullish wave isn’t over yet and there is a possibility of touching 127.2% correction at 1.6005. Linear Regression Indicators support these expectations but momentum indicators are showing overbought signals, whereas the pair shouldn’t break 1.5875 and stabilize below to keep the possibility valid.
The trading range for today is among the key support at 1.5770 and key resistance at 1.6055.
The general trend over short term basis is to the upside as far as areas of 1.5100 remains intact targeting 1.6010.

USD/JPYUSD/JPY Daily Chart" title="USD/JPY Daily Chart" src="https://d1-invdn-com.akamaized.net/content/pic9de0ce1ffbddc1206529e6de26747e3e.png" height="746" width="1596">
The pair failed to breach 99.35 levels represented in 61.8% correction again during the Asian session today, forcing us to think that the downside move is still available that started from the top around 78.6% correction at 100.30 earlier. Breaking 98.65 will push the pair further to the downside.
The trading range for today is among key support at 98.00 and key resistance at 100.30.
The general trend over short term basis is to the downside as far as areas of 103.50 remain intact targeting 93.50.

USD/CHFUSD/CHF Daily Chart" title="USD/CHF Daily Chart" src="https://d1-invdn-com.akamaized.net/content/picbc5dff11b7e7a1d2673b814b665ba9ee.png" height="746" width="1596">
By examining the graph, we notice the negative bias of the pair. Whereas stability below 0.9290 keeps the downside move valid and it might lead to further bearishness in the upcoming period. Stochastic tends to the downside and RSI failed to trade above 50 levels supporting our negative expectations.
The trading range for today is between the key support at 0.9125 and the key resistance at 0.9320.
The general trend over short term basis is to the downside stable at levels 0.9775 targeting 0.8860.

USD/CAD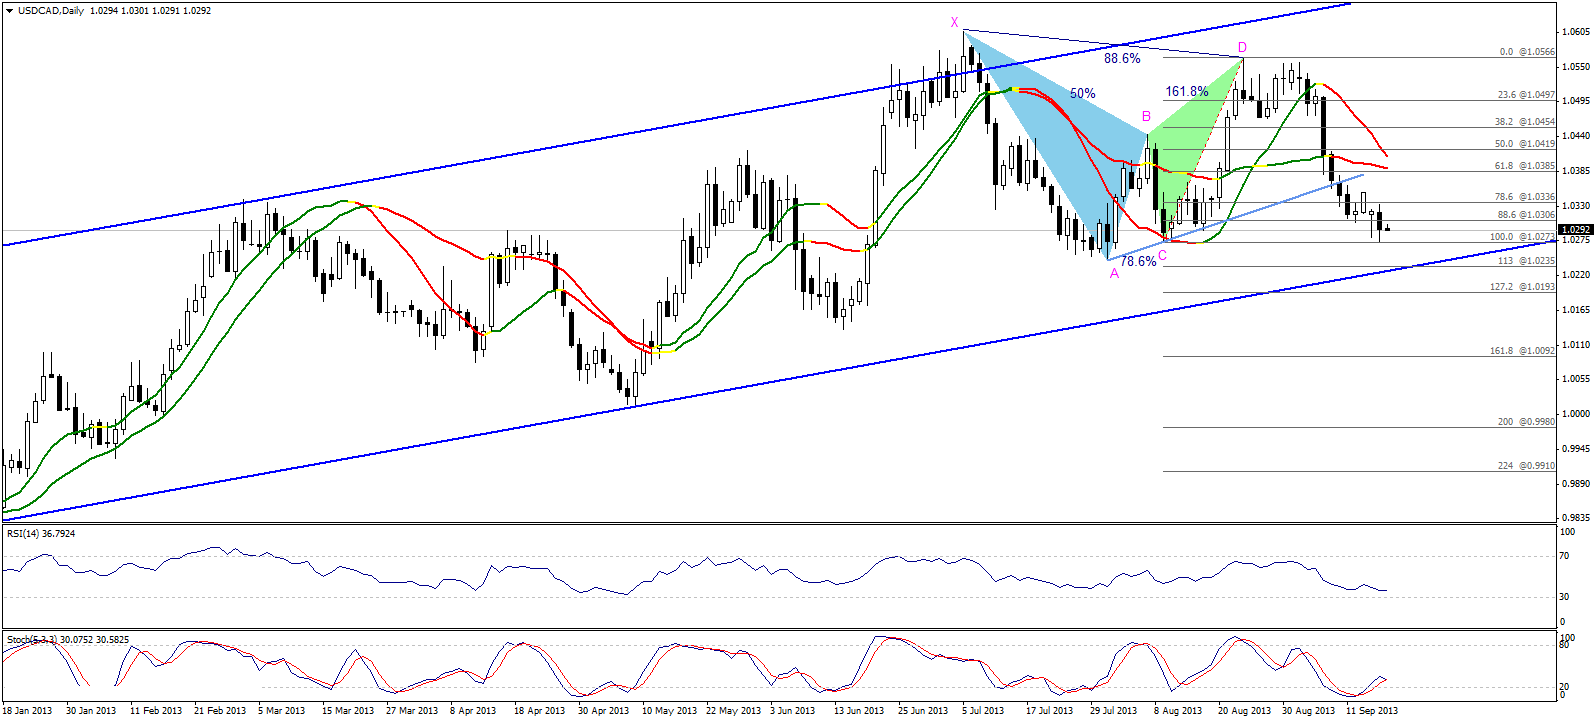 USD/CAD" border="0" height="719" width="1596">
The pair witnessed a negative continues pressure as it managed to stabilize below 88.6% correction of CD Leg of the bearish harmonic Bat Pattern. Stability below the referred to level might trigger an attempt to break bottom C at 1.0273 to the downside towards 1.0235 and perhaps an attempt to test 1.0190 represented in 113% and 127.2% corrections as shown on graph. The downside move depends on stabilizing below 1.0335 today.
The trading range for today is between the key support at 1.0190 and the key resistance at 1.0385.
The general trend over short term basis is to the upside with steady daily closing above levels 1.0100 targeting 1.0775.

AUD/USD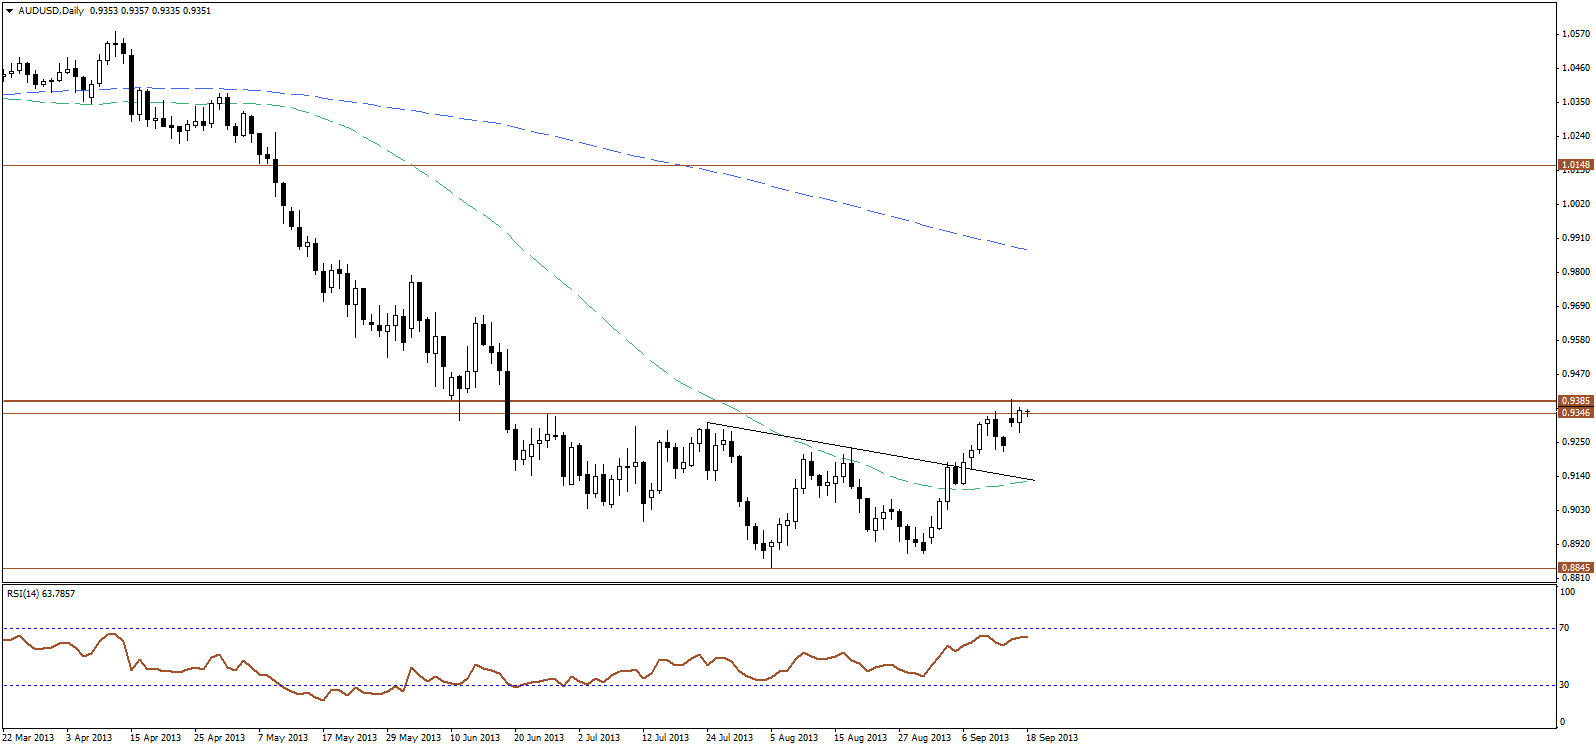 AUD/CAD" border="0" height="746" width="1596">
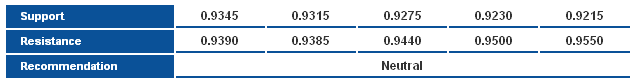
The pair moved higher yesterday, but failed to surpass the previous high at 0.9385, which is the key low of 2011, accordingly, a decisive break above this resistance area is required to confirm further upside, and extend the bullish reversal.
NZD/USD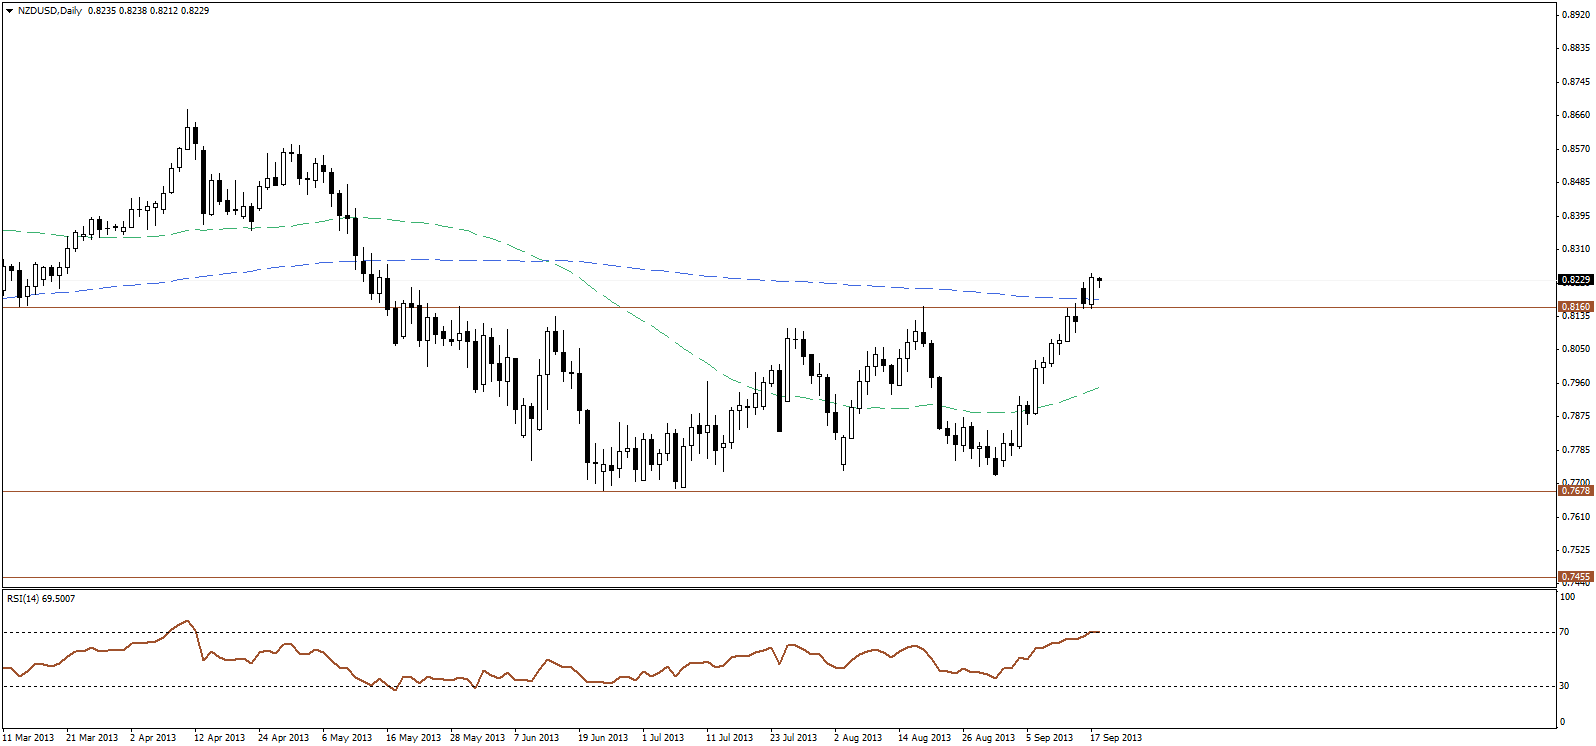 NZD/USD" border="0" height="746" width="1596">
The NZD/USD rebounded strongly yesterday, to re-break the 200-days SMA and settle above 0.8200. Accordingly, the bullish scenario is favored, and may extend further as price may have completed a major bottom. Holding above 0.8160 and 0.8100 is necessary for the bullish bias to remain dominant and this scenario to remain likely.
