EUR/USD
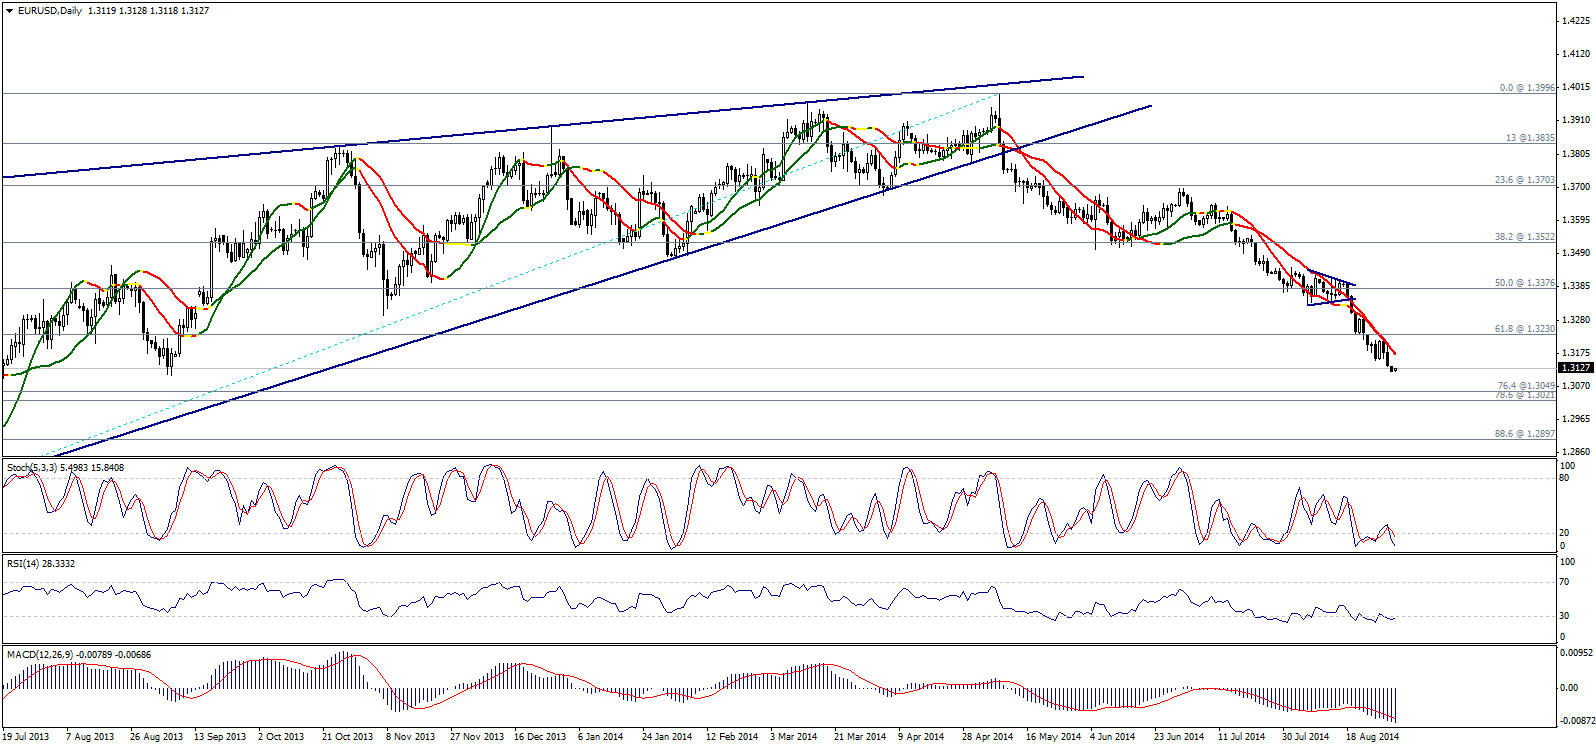
This week's trading opened to the downside which is normal in light of breaking 61.8% correction earlier. Stability below 1.3230 at 61.8% correction keeps the possibilities of further bearishness to touch 1.3050 - 1.3020 represented in 76.4% - 78.6% corrections as showing on graph.
Momentum indicators are showing oversold signals, but we will depend on the negativity showing on Linear Regression Indicators to suggested further bearishness. Of note, breaking the psychological barrier 1.3000 this week extends the downside move in the upcoming session towards 1.2960 and 1.2895.

GBP/USD
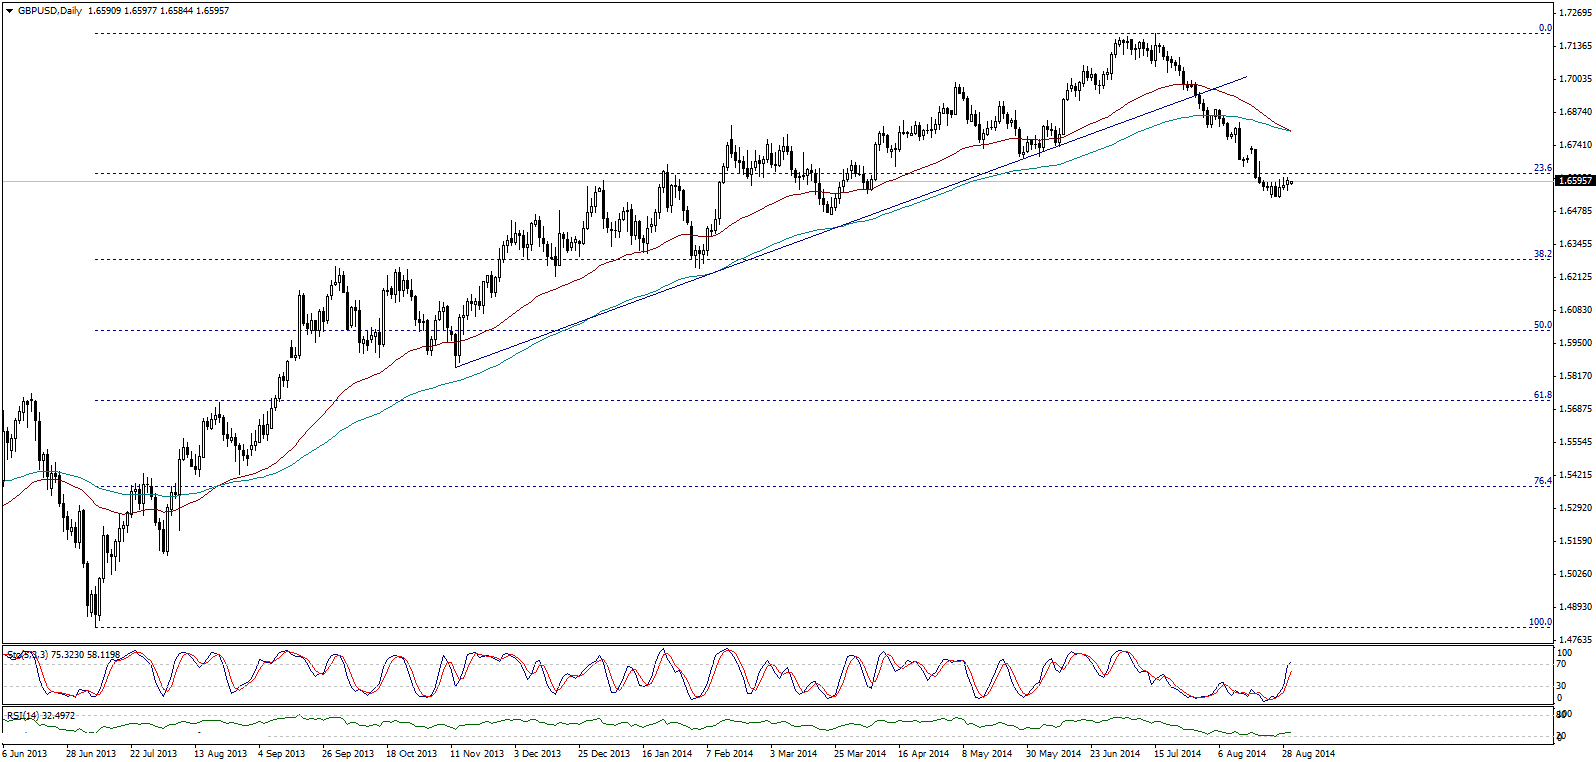
The pair is still providing sideways trading as Stochastic is still approaching overbought levels supporting the expectations of the bearish correctional move and its main next target resides at 1.6285. Of note, breaching 1.6625 halts the suggested negative scenario and pushes the pair to test 1.6800.

USD/JPY
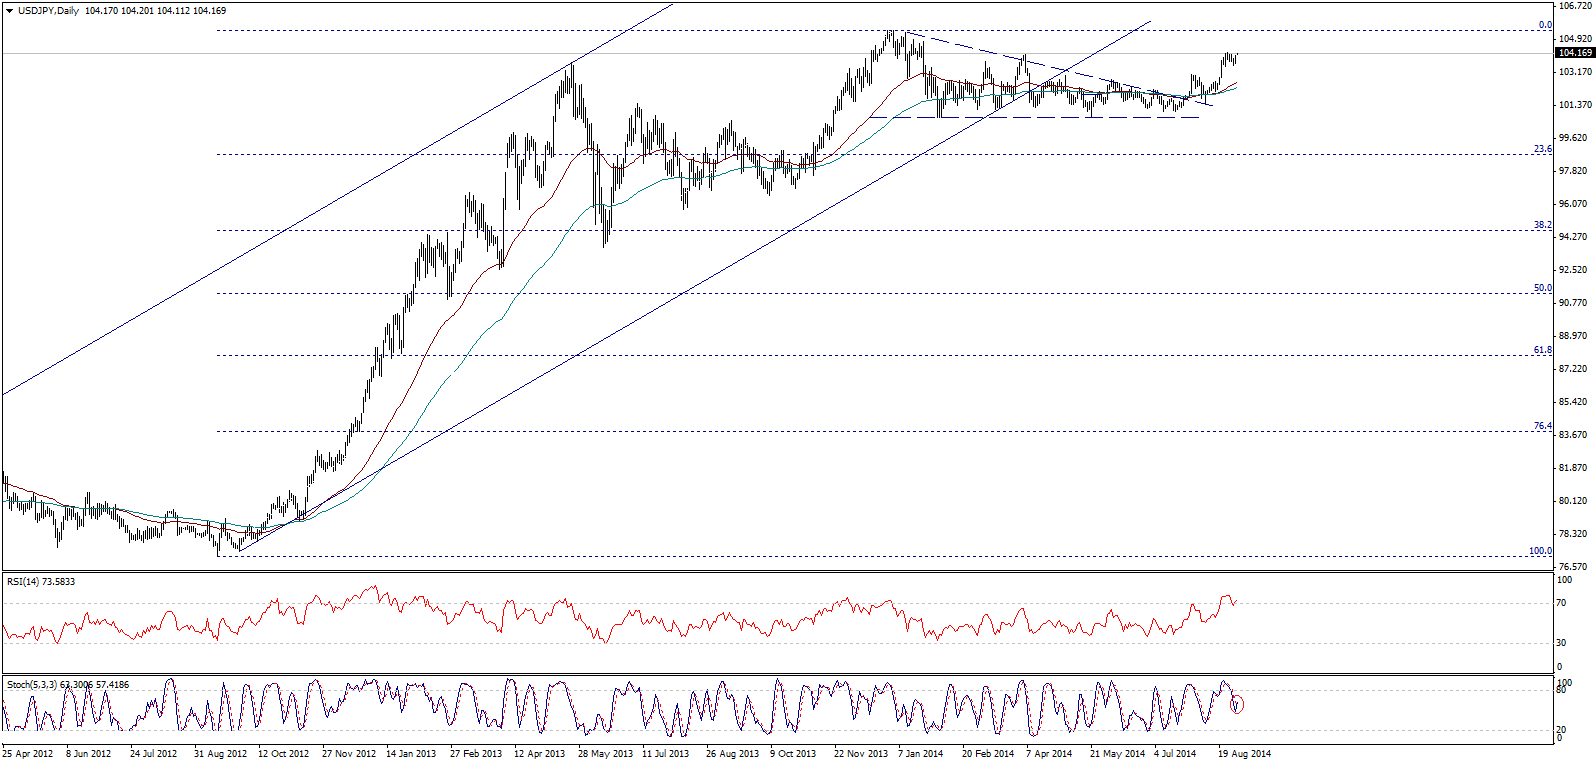
The pair traded again above 104.00 and is getting further positive catalysts that support the bullish bias intraday, whereas SMA 50 and 100 are still supporting the pair from the downside. Hence, the bullish scenario remains valid in the upcoming period as long as the pair stabilizes above 102.35.

USD/CHF
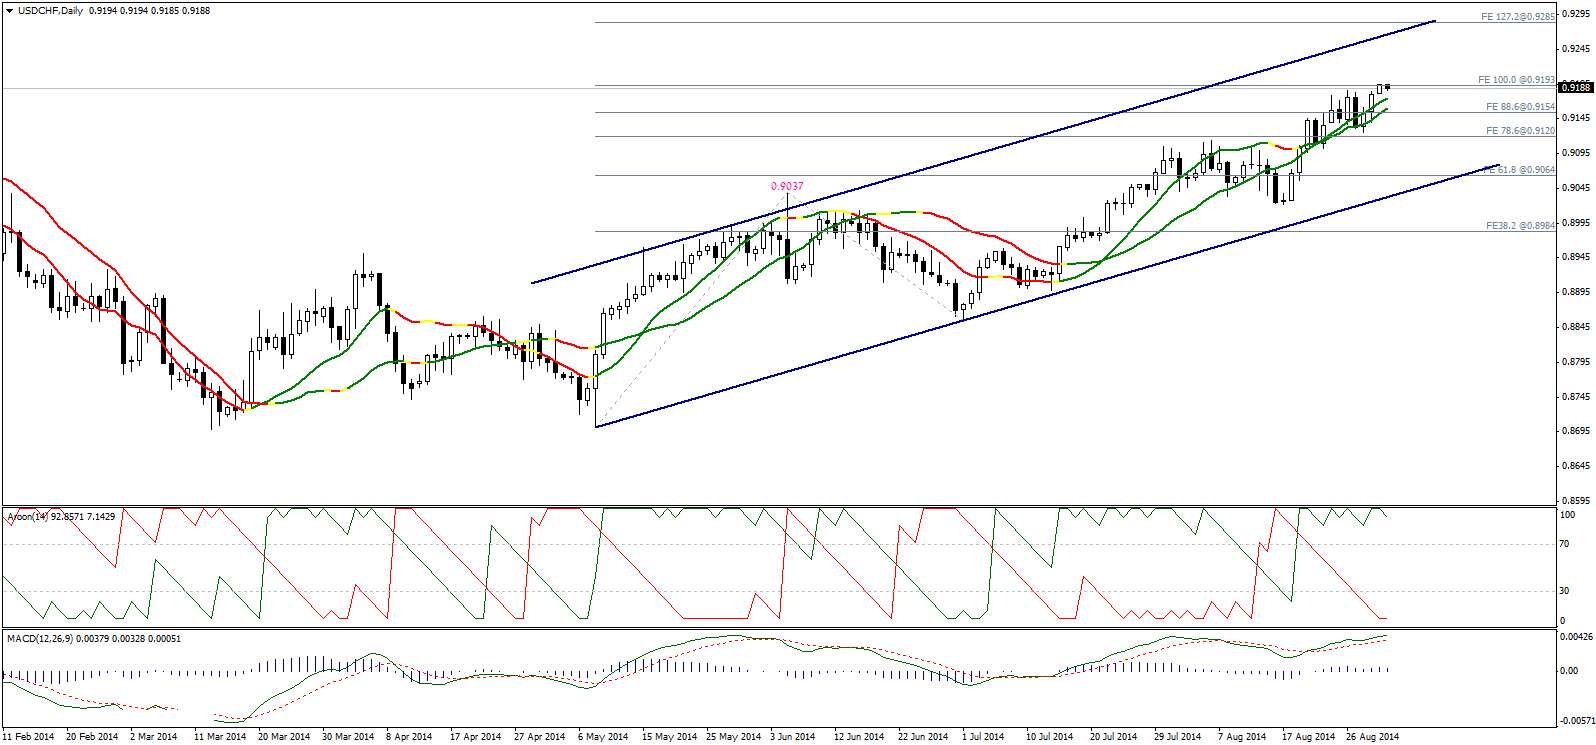
The pair inched higher touching this week 100% correction represented in 0.9195. This level is considered a significant interval this week, whereas stabilizing above it extends the upside move towards 0.9285 at least and perhaps further towards 0.9405 in the upcoming period.
On the other hand, failing to stabilize above the mentioned level and break again 0.9120 threatens the upside move and triggers a bearish wave and gets the pair into a bearish correction. The technical indicators are positive; AROON and MACD are positive as showing on graph, and we will depend on that to suggest an upside move this week also, but we recommend following this report for updates waiting for signals that confirms or cancel the positive expectations.

USD/CAD
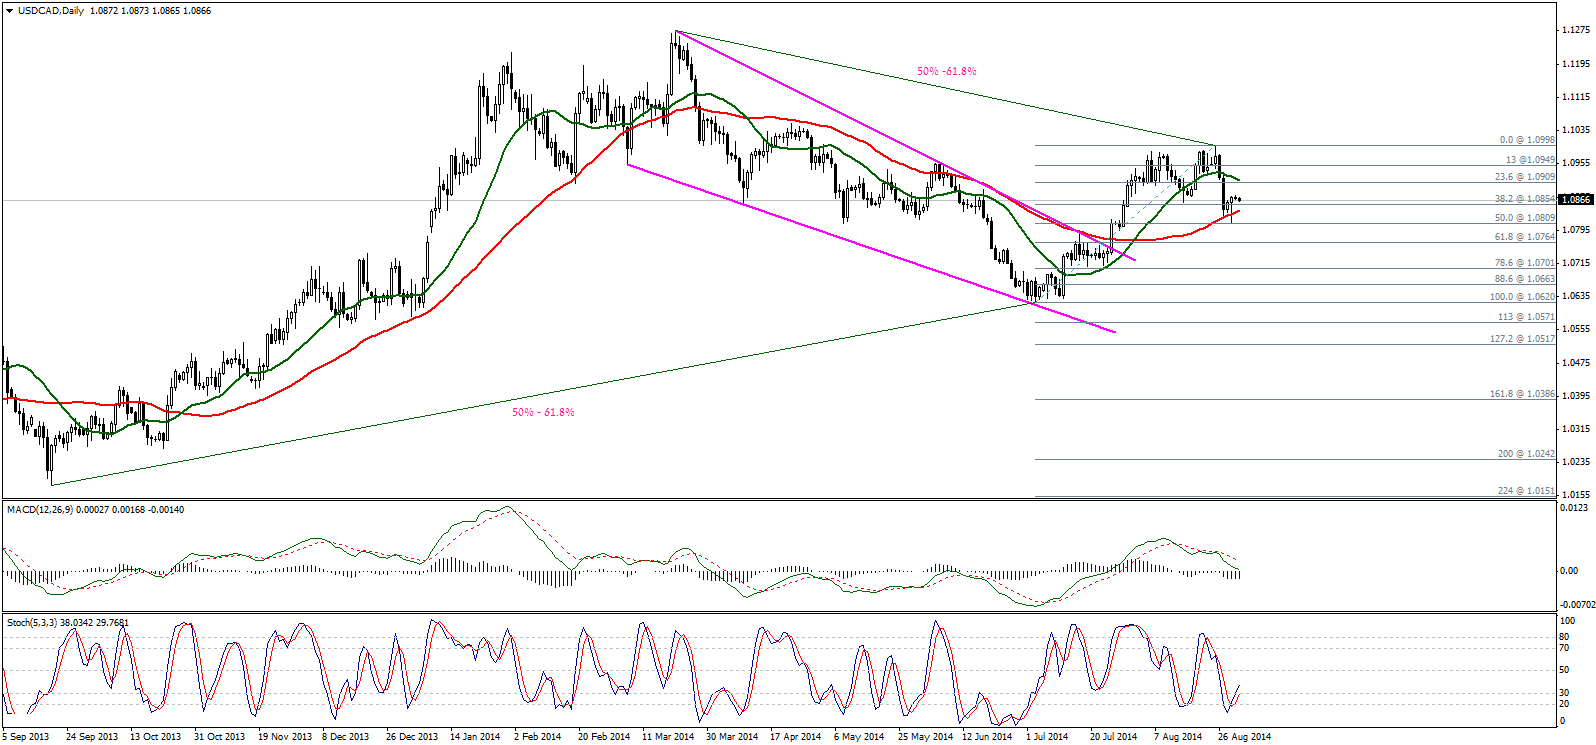
The pair dropped last week after failing to stabilize above the psychological barrier 1.1000. The pair is currently trading between SMA 20 and 50, and breaking 1.0805 this week could extend the bearish correction.
MACD is trading negatively but Stochastic is referring to the rise in the bullish momentum. But we will bet on a downside move as long as the pair is stable below 1.1000 and below 1.0985 this week.

AUD/USD
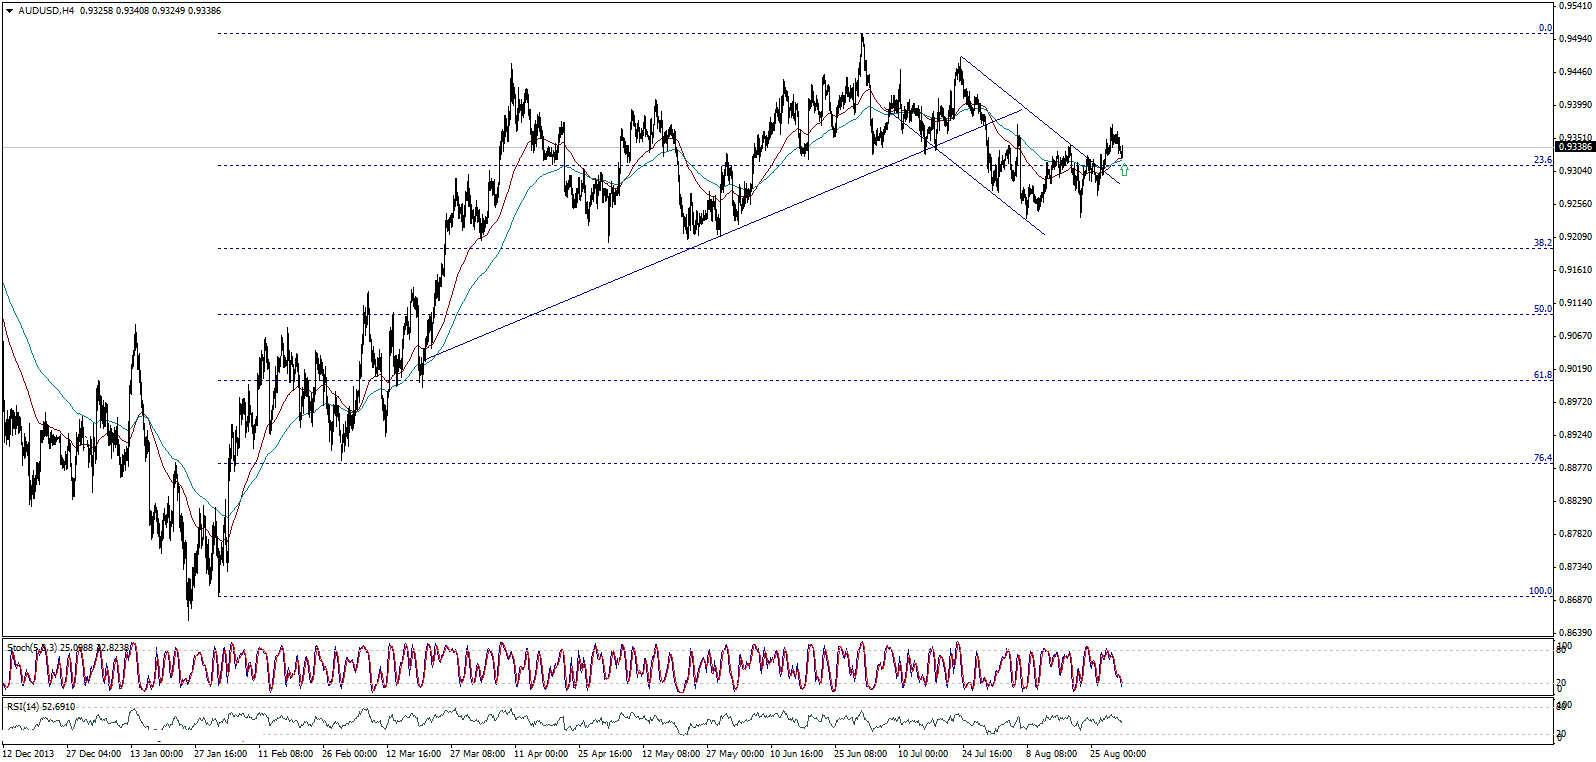
The pair found good support formed by SMA 50 and 100 and is showing signs of a bullish rebound now and extended the positive expectations suggested in our latest reports after stabilizing above 0.9310 waiting to move towards the first target 0.9500. Breaching the latter extends the bullish wave towards 0.9700, while a break below 0.9310 puts negative pressure towards 0.9190.

NZD/USD
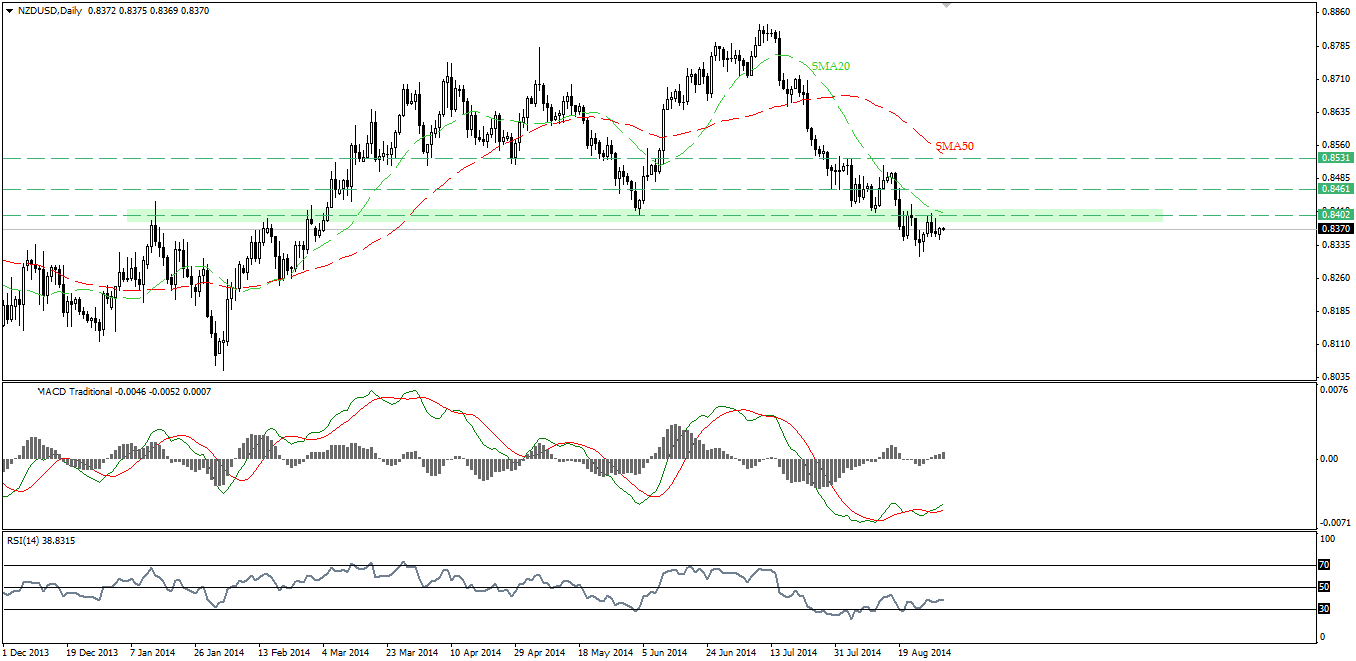
NZDUSD has been locked in a consolidation mode following the bounce from 0.8310 boundaries. However, we can’t chase this recovery since 0.8400 is still acting as a ceiling. The intersection between this resistance level and SMA20 is another technical catalyst that forces us to remain neutral on the pair despite the positivity on MACD. Resuming the main downtrend depends on breaching 0.8310, while achieving considerable recovery depend on the price behaviors around 0.8400.

