Get 40% Off
👀 👁 🧿 All eyes on Biogen, up +4,56% after posting earnings. Our AI picked it in March 2024.
Which stocks will surge next?
Unlock AI-picked Stocks

GBP Moves In Sideways Range; JPY Soars

Published 05/30/2016, 06:34 AM
Updated 07/09/2023, 06:31 AM

GBP/USD

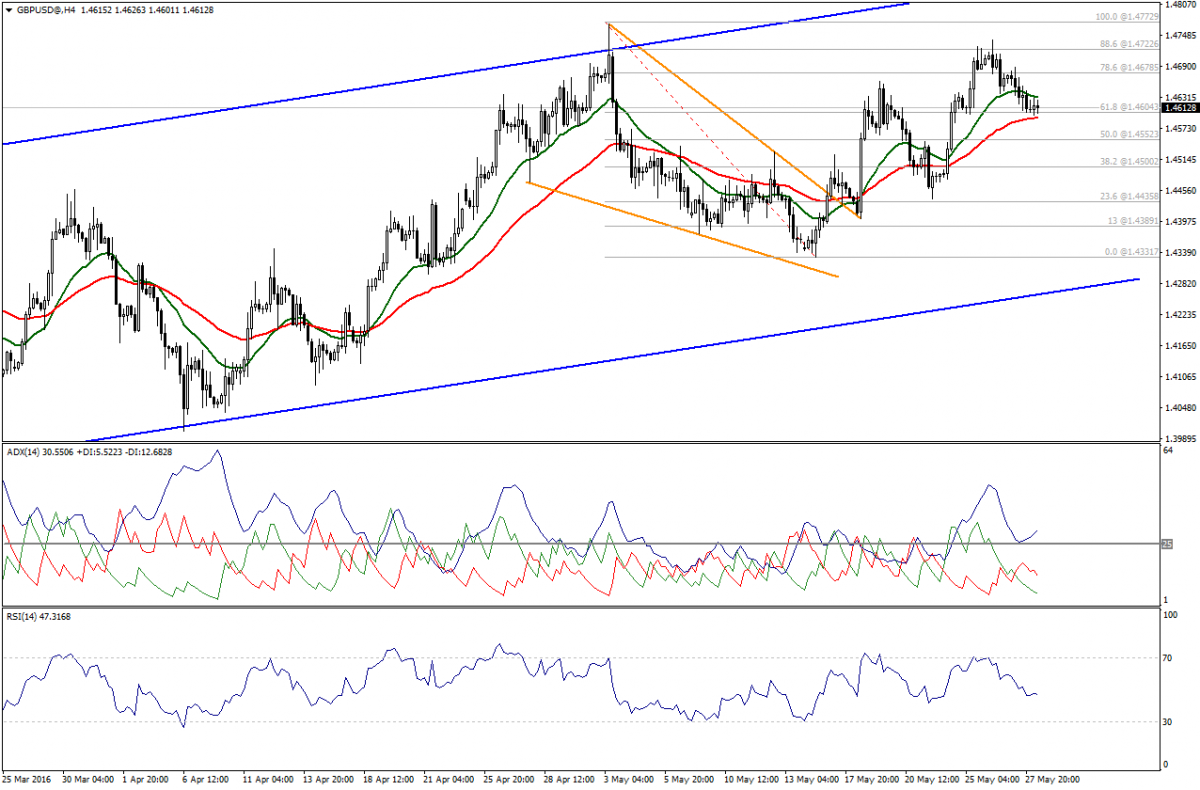
GBP/USD moves within a sideways range between SMA20 and SMA50, while trading near 1.4600 should be breached to prove the bearishness.

GBP/USD Chart

ADX remains negative below 50.00, but it moves within a sideways range.

To recap, we need a breakout below 1.4600 to be bearish.

Support: 1.4600 – 1.4550 – 1.4500

Resistance: 1.4680 – 1.4725 – 1.4775

Direction: Neutral

USD/JPY

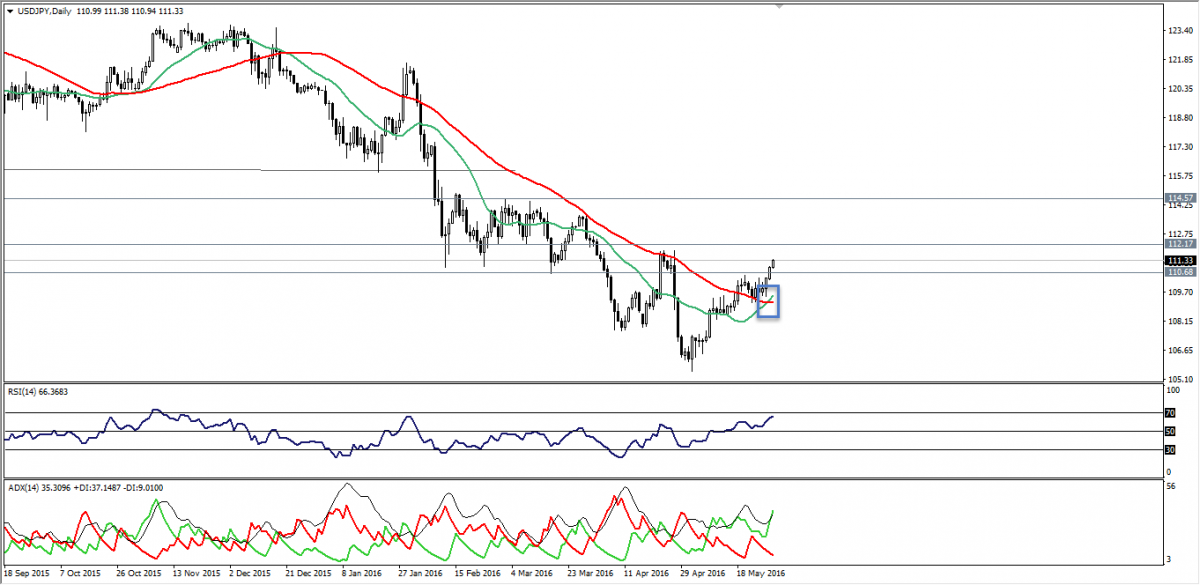
USD/JPY has soared, respecting the bullish scenario we suggested during the previous period.

USD/JPY Chart

In the last report on Friday, we said moving averages might overlap positively, and they succeeded in overlapping bullishly for the first time since early November 2015.

ADX is positive along with RSI; hence, we remain bullish over upcoming period, aiming to hit 111.65 resistance followed by 112.40.

Support: 111.05-110.60-110.30

Resistance: 111.65-112.10-112.40

Direction: Bullish

USD/CHF

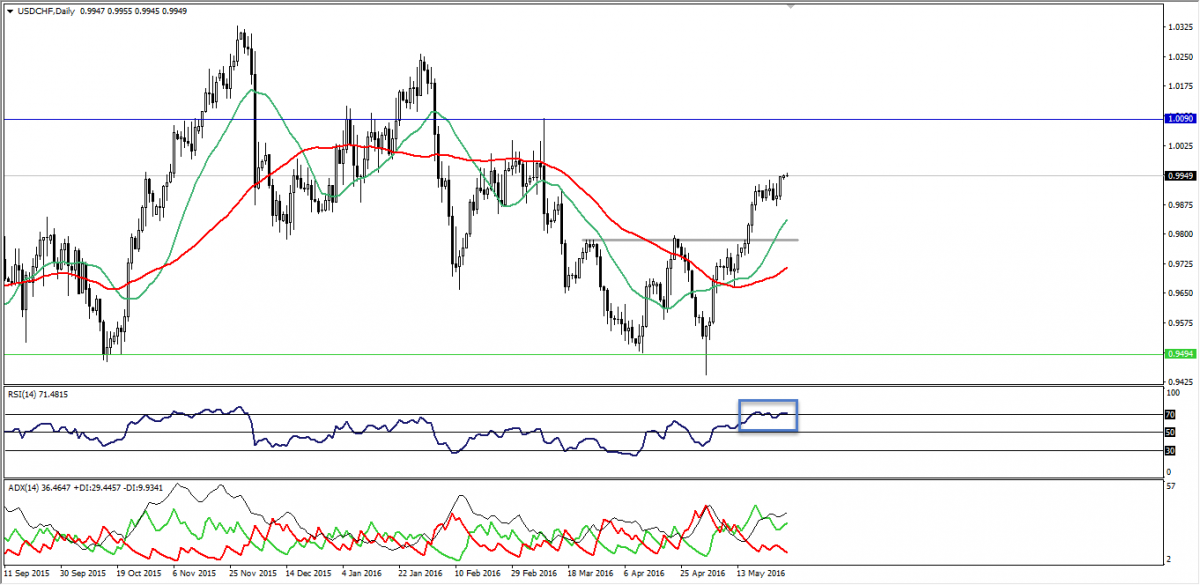
Clear overbought signs on RSI over daily studies that could prevent the USD/CHF pair from achieving further development.

USD/CHF Chart

Additionally, the pair faces hard obstacles in the 0.9950-0.9960 zones.

We should be patient, since today U.S. market is off and that may cause fluctuation amid lackluster volumes.

We will be on the sidelines now; noting that, a break below 0.9880 will be negative signal.

Support: 0.9905-0.9880-0.9860

Resistance: 0.9980-1.0000-1.0060

Direction: Neutral

EUR/USD

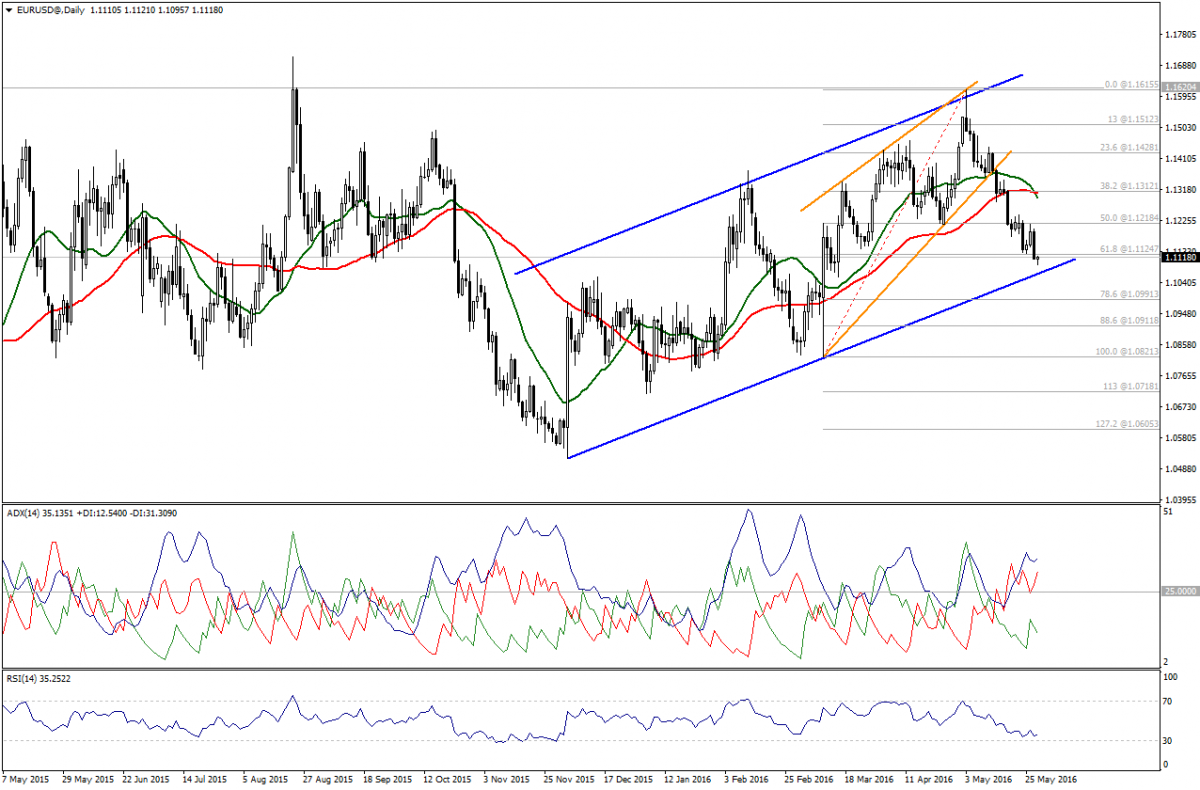
Euro traded below 61.8% Fibonacci at 1.1125, which may extend the bearishness towards 78.6% at 1.0990 according to Fibonacci rules.

EUR/USD Chart

But the support of 1.1060 should be cleared to expose that level; noting that, ADX is negative and also moving averages.

Hence, we are bearish today.

Support: : 1.1100 – 1.1060 – 1.0990

3rd party Ad. Not an offer or recommendation by Investing.com. See disclosure here or remove ads .

Resistance: 1.1125 –1.1170 – 1.1220

Direction: Bearish

Latest comments

Risk Disclosure: Trading in financial instruments and/or cryptocurrencies involves high risks including the risk of losing some, or all, of your investment amount, and may not be suitable for all investors. Prices of cryptocurrencies are extremely volatile and may be affected by external factors such as financial, regulatory or political events. Trading on margin increases the financial risks.
Before deciding to trade in financial instrument or cryptocurrencies you should be fully informed of the risks and costs associated with trading the financial markets, carefully consider your investment objectives, level of experience, and risk appetite, and seek professional advice where needed.
Fusion Media would like to remind you that the data contained in this website is not necessarily real-time nor accurate. The data and prices on the website are not necessarily provided by any market or exchange, but may be provided by market makers, and so prices may not be accurate and may differ from the actual price at any given market, meaning prices are indicative and not appropriate for trading purposes. Fusion Media and any provider of the data contained in this website will not accept liability for any loss or damage as a result of your trading, or your reliance on the information contained within this website.
It is prohibited to use, store, reproduce, display, modify, transmit or distribute the data contained in this website without the explicit prior written permission of Fusion Media and/or the data provider. All intellectual property rights are reserved by the providers and/or the exchange providing the data contained in this website.
Fusion Media may be compensated by the advertisers that appear on the website, based on your interaction with the advertisements or advertisers.
© 2007-2024 - Fusion Media Limited. All Rights Reserved.