Get 40% Off
🚨 Volatile Markets? Find Hidden Gems for Serious OutperformanceFind Stocks Now

Daily Technical Report: July 1st, 2015

Published 07/01/2015, 05:09 AM
Updated 07/09/2023, 06:31 AM

GBP/USD

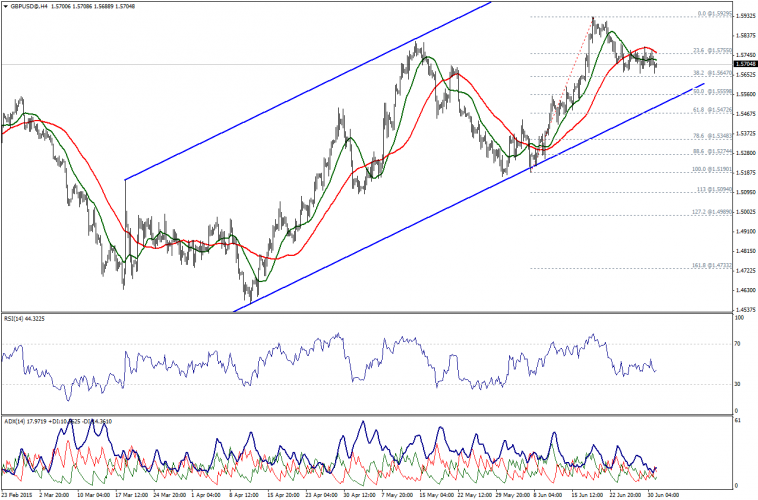
GBP/USD has declined slightly, reinforced by moving below SMA20 and SMA50.
GBP/USD 4 Hour Chart

Failure to hit 23.6% Fibonacci at 1.5755 makes the market attempts to move lower.

Breaching through 1.5645 is essential to prove the bearishness and to affirm ADX signal.

Support: 1.5700-1.5645-1.5600

Resistance: 1.5755-1.5780-1.5800

Direction: Down

EUR/USD

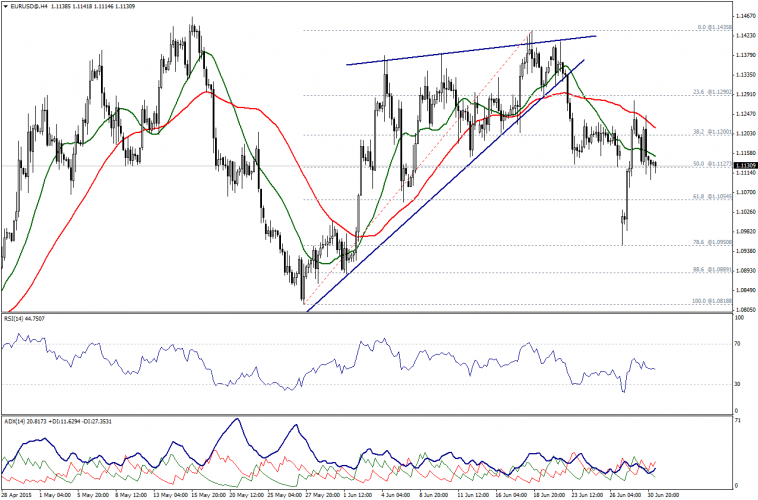
Sharp fluctuation due to the Greek crisis, as the EUR/USD pair has failed to maintain levels above SMA50 and is currently trading below SMA20.
EUR/USD 4 Hour Chart

The pair is trading around 50% Fibonacci and that forces us to be neutral over intraday basis, while 1.1125 should be watched out carefully.

Support: 1.1100-1.1055-1.0950

Resistance: 1.1170-1.1200-1.1260

Direction: Sideways

USD/CHF

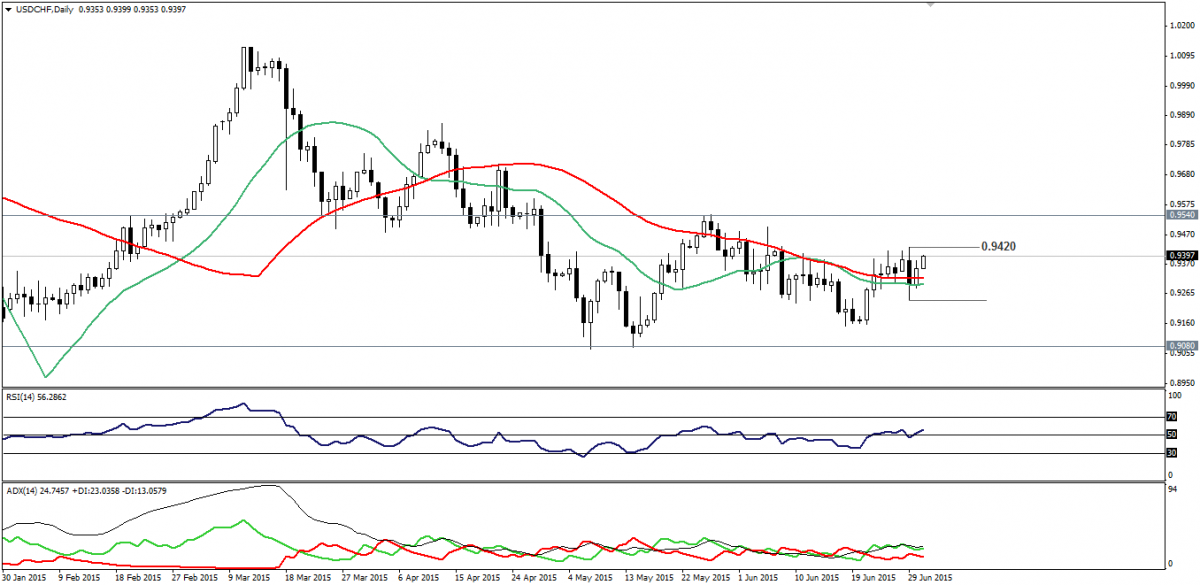
USD/CHF has bounced sharply to trade above moving averages 20 and 50 once again as seen on the provided daily chart.
USD/CHF Daily Chart

RSI14 and ADX are now positive, and that may assist traders to clear the cluster resistance of 0.9425.

To be prudent, no long positions should be taken before taking the aforesaid resistance.

Support: 0.9355-0.9315-0.9275.

Resistance: 0.9425-0.9460-0.9500

Direction: Bullish

USD/JPY

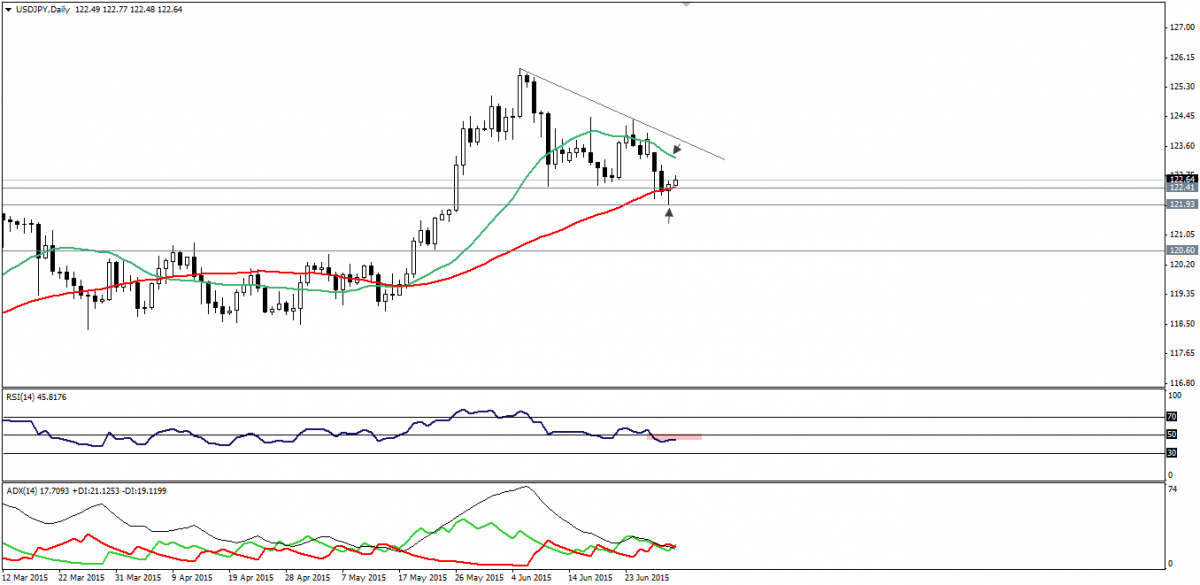
The bounce from 121.90 on USD/JPY warns of entering a consolidation mode following the sharp declines seen during the previous period.
USD/JPY Daily Chart

Still, there is some kind of hesitation and uncertainty about upside actions due stability below SMA20, while RSI14 is still trading below the value of 50.00.

Hence, we will watch the price behaviors today to see whether USD/JPY will continue to stabilize above 122.40-pivot point - or it is just a false breakout.

Support: 122.40-121.90-121.50

Resistance: 122.85-123.20-123.75

Direction: Sideways

Latest comments

Risk Disclosure: Trading in financial instruments and/or cryptocurrencies involves high risks including the risk of losing some, or all, of your investment amount, and may not be suitable for all investors. Prices of cryptocurrencies are extremely volatile and may be affected by external factors such as financial, regulatory or political events. Trading on margin increases the financial risks.
Before deciding to trade in financial instrument or cryptocurrencies you should be fully informed of the risks and costs associated with trading the financial markets, carefully consider your investment objectives, level of experience, and risk appetite, and seek professional advice where needed.
Fusion Media would like to remind you that the data contained in this website is not necessarily real-time nor accurate. The data and prices on the website are not necessarily provided by any market or exchange, but may be provided by market makers, and so prices may not be accurate and may differ from the actual price at any given market, meaning prices are indicative and not appropriate for trading purposes. Fusion Media and any provider of the data contained in this website will not accept liability for any loss or damage as a result of your trading, or your reliance on the information contained within this website.
It is prohibited to use, store, reproduce, display, modify, transmit or distribute the data contained in this website without the explicit prior written permission of Fusion Media and/or the data provider. All intellectual property rights are reserved by the providers and/or the exchange providing the data contained in this website.
Fusion Media may be compensated by the advertisers that appear on the website, based on your interaction with the advertisements or advertisers.
© 2007-2024 - Fusion Media Limited. All Rights Reserved.