Get 40% Off
🚨 Volatile Markets? Find Hidden Gems for Serious OutperformanceFind Stocks Now

GBP/USD Trades Above 1.4525; EUR/USD Moves Bearishly

Published 02/08/2016, 03:40 AM
Updated 07/09/2023, 06:31 AM

GBP/USD

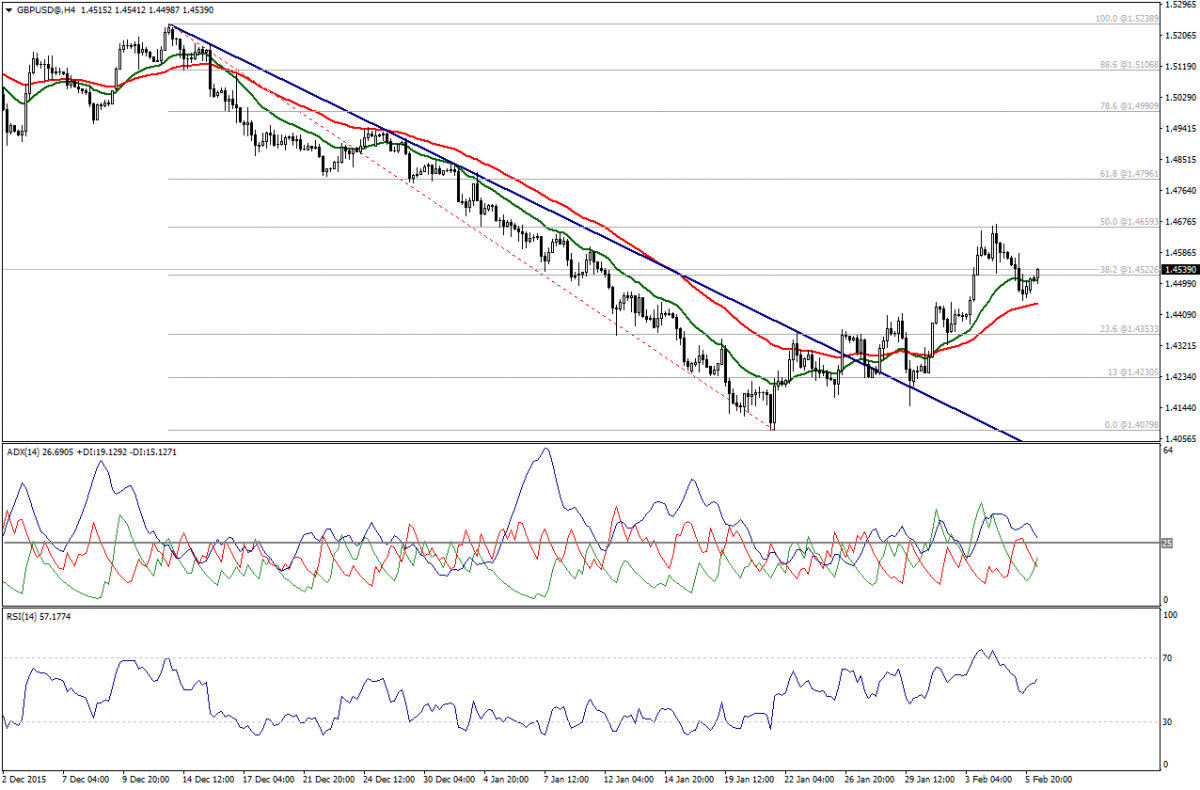
GBP/USD has inclines with the opening of the European session, trading above 1.4525 zone and that means traders are taking out moving averages.

GBP/USD H4 Chart

ADX shows positive crossover, while RSI stabilizes above 50.00 levels, which offer positive signals that may extend the bullishness.

As far as 1.4435-SMA50- holds, we will be bullish on GBP/USD pair.

Support: 1.4525 – 1.4435 – 1.4380

Resistance: 1.4600 – 1.4660 – 1.4755

Direction: Bullish attempt

EUR/USD

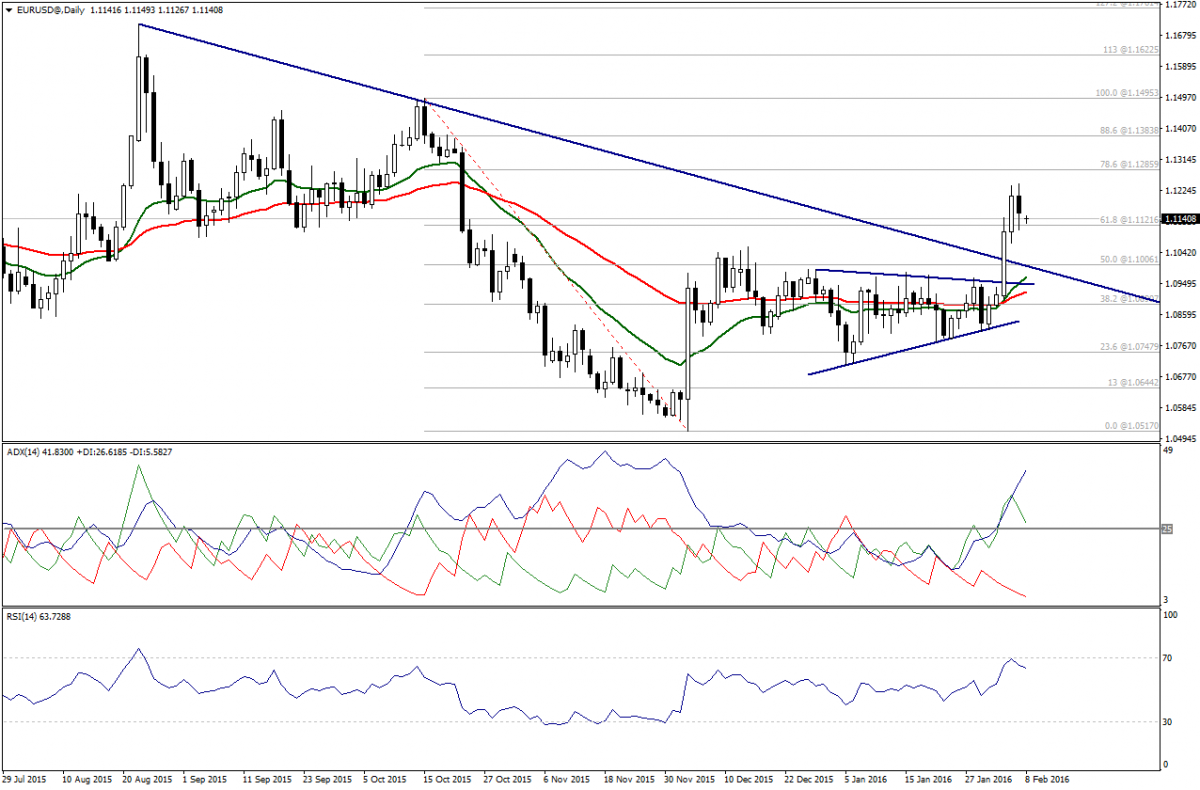
EUR/USD has moved bearishly with the opening of this week, but it is still limited above 61.8% Fibonacci, which offers a positive factor.

EUR/USD Daily Chart

Trading above 1.1005 is positive, while 1.1000 protects the bullishness from the underside and trading above 1.1120 is good for intraday traders.

ADX remains bullish, while moving averages continue to carry the bullishness from the underside.

To recap, we remain bullish on EUR/USD.

Support: 1.1120 – 1.1040 – 1.1005

Resistance: 1.1200 –1.1285 – 1.1385

Direction: Bullish

USD/CHF

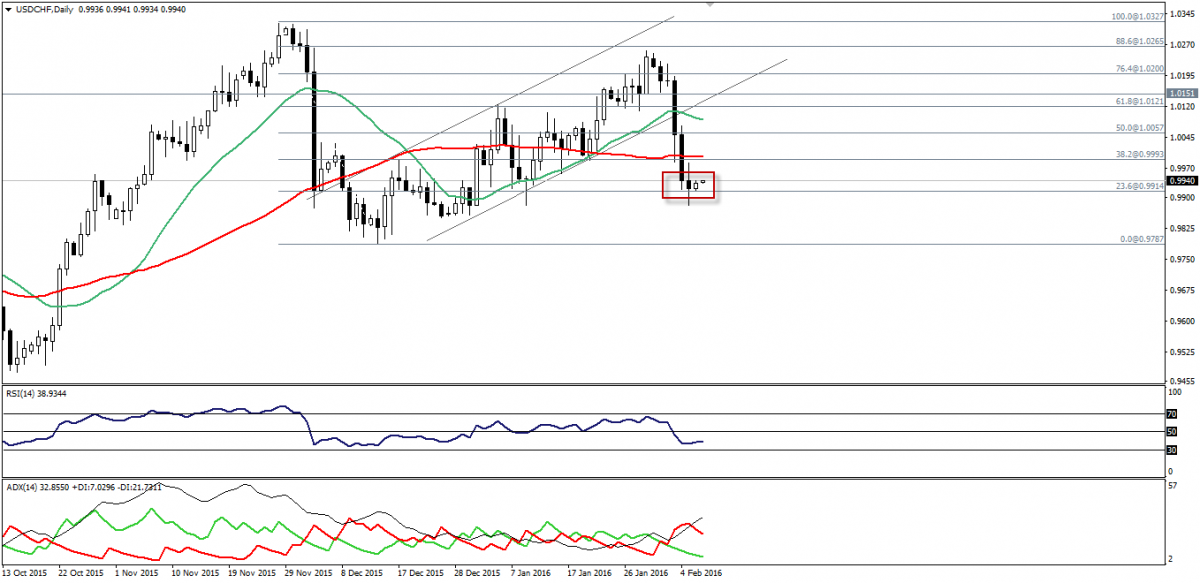
The pair has reached our technical target defined last week at 0.9915 where it met 23.6% Fibonacci to start some kind of consolidation.

USD/CHF Daily Chart

Stability below moving averages and below 38.2% Fibonacci should provide bearish pressures; however, we will be patient until the pair clears the afore-mentioned support to follow through.

All eyes should be also on 0.9993 where 38.2% Fibonacci exists, as breaching it may bring further upside correction.

Support: 0.9915-0.9855-0.9790

Resistance: 0.9960-1.0000-1.0050

Direction: Neutral, but bearish below 0.9915

USD/JPY

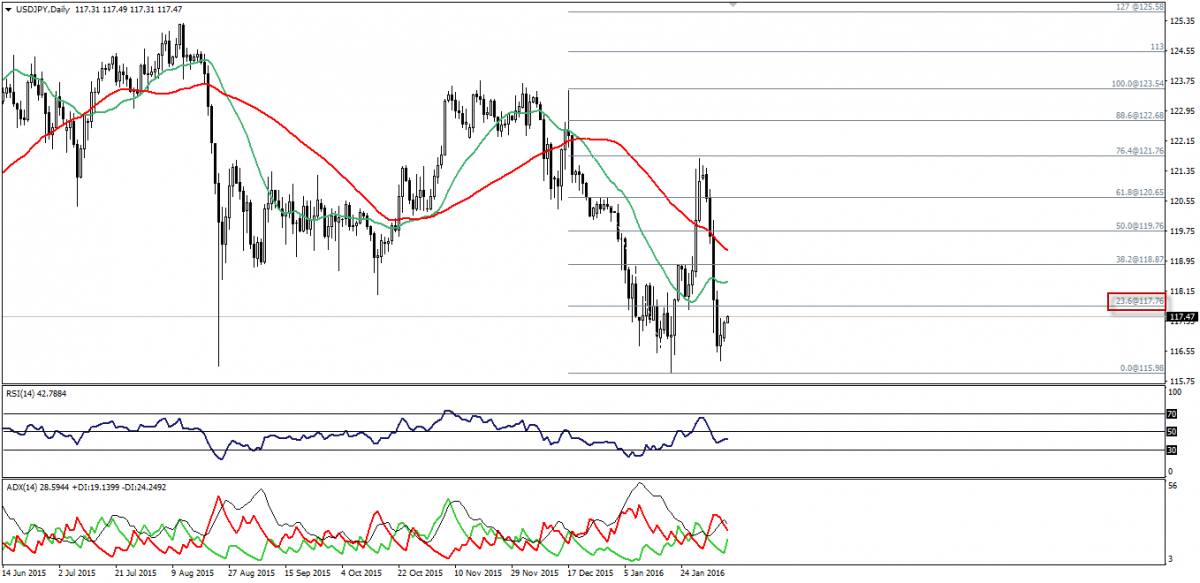
According to our previous analysis, the USD/JPY pair has plummeted towards 116.40-116.30 zones, which represent one of our detected targets, but this support has pushed the pair again upwards again.

3rd party Ad. Not an offer or recommendation by Investing.com. See disclosure here or remove ads .

USD/JPY Daily Chart

Currently, USD/JPY is trading below 23.6% Fibonacci at 117.75, while RSI and ADX couldn’t give off reliable signals for the next big move.

Hence, it is better to stand aside, as risk versus reward ratio is inappropriate.

However, any sharp attacks on intraday support of 116.80 may bring the bearish picture back into focus.

Support: 117.00-116.30-115.90

Resistance: 117.75-118.30-118.80

Direction: Neutral

Latest comments

Risk Disclosure: Trading in financial instruments and/or cryptocurrencies involves high risks including the risk of losing some, or all, of your investment amount, and may not be suitable for all investors. Prices of cryptocurrencies are extremely volatile and may be affected by external factors such as financial, regulatory or political events. Trading on margin increases the financial risks.
Before deciding to trade in financial instrument or cryptocurrencies you should be fully informed of the risks and costs associated with trading the financial markets, carefully consider your investment objectives, level of experience, and risk appetite, and seek professional advice where needed.
Fusion Media would like to remind you that the data contained in this website is not necessarily real-time nor accurate. The data and prices on the website are not necessarily provided by any market or exchange, but may be provided by market makers, and so prices may not be accurate and may differ from the actual price at any given market, meaning prices are indicative and not appropriate for trading purposes. Fusion Media and any provider of the data contained in this website will not accept liability for any loss or damage as a result of your trading, or your reliance on the information contained within this website.
It is prohibited to use, store, reproduce, display, modify, transmit or distribute the data contained in this website without the explicit prior written permission of Fusion Media and/or the data provider. All intellectual property rights are reserved by the providers and/or the exchange providing the data contained in this website.
Fusion Media may be compensated by the advertisers that appear on the website, based on your interaction with the advertisements or advertisers.
© 2007-2024 - Fusion Media Limited. All Rights Reserved.