GBP/USD - Technical Report
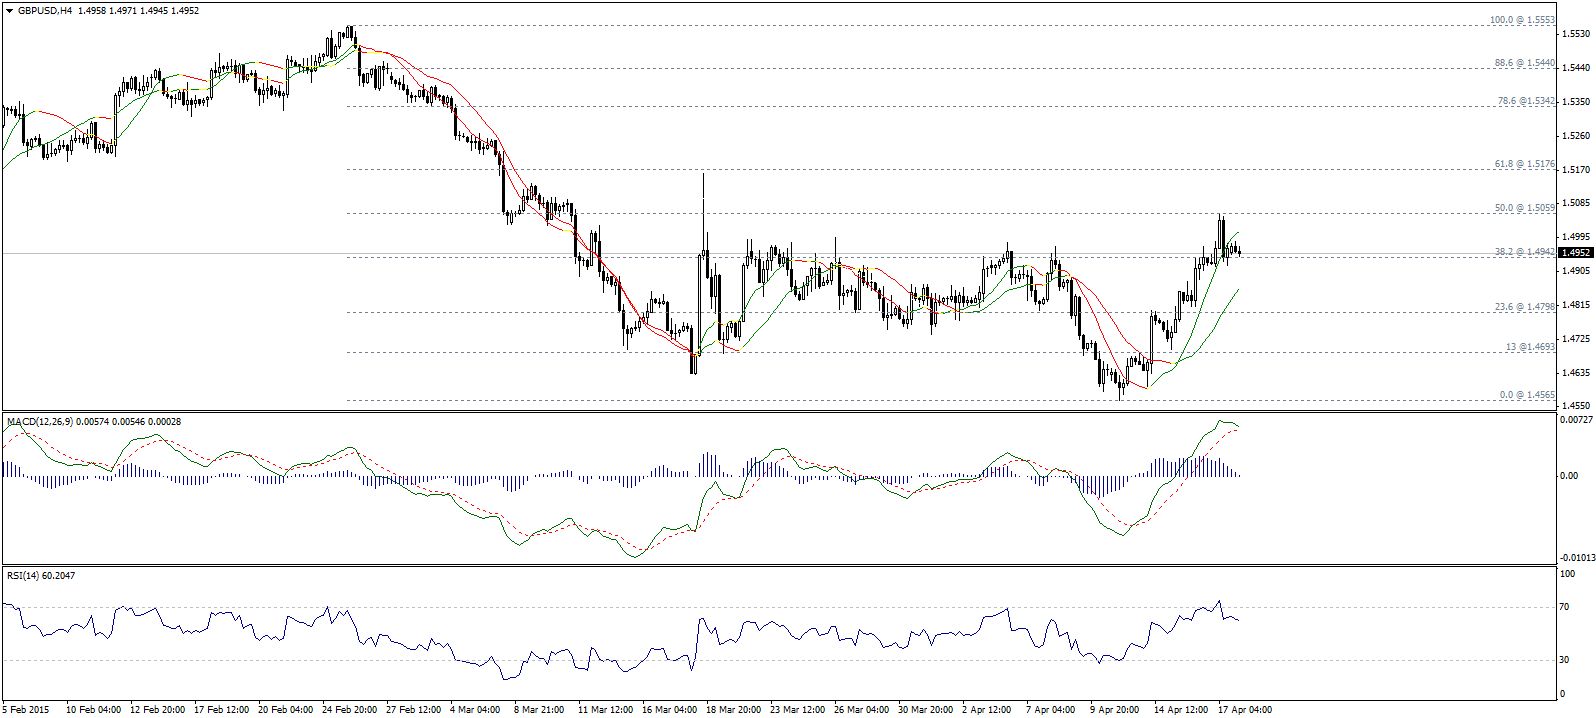
The pair was rejected from 1.5060 resistance level presented by 50% Fibonacci correction shown on the image above. Trading below 1.5000 could cause more bearish correction, especially while the pair is trading below linear regression indicator 34.
On the other hand, we need to wait breaching down 1.4920 to confirm the bearishness on MACD indicator and RSI14. On recap, we will be neutral, waiting to confirm the bearishness.

USD/JPY - Technical Report
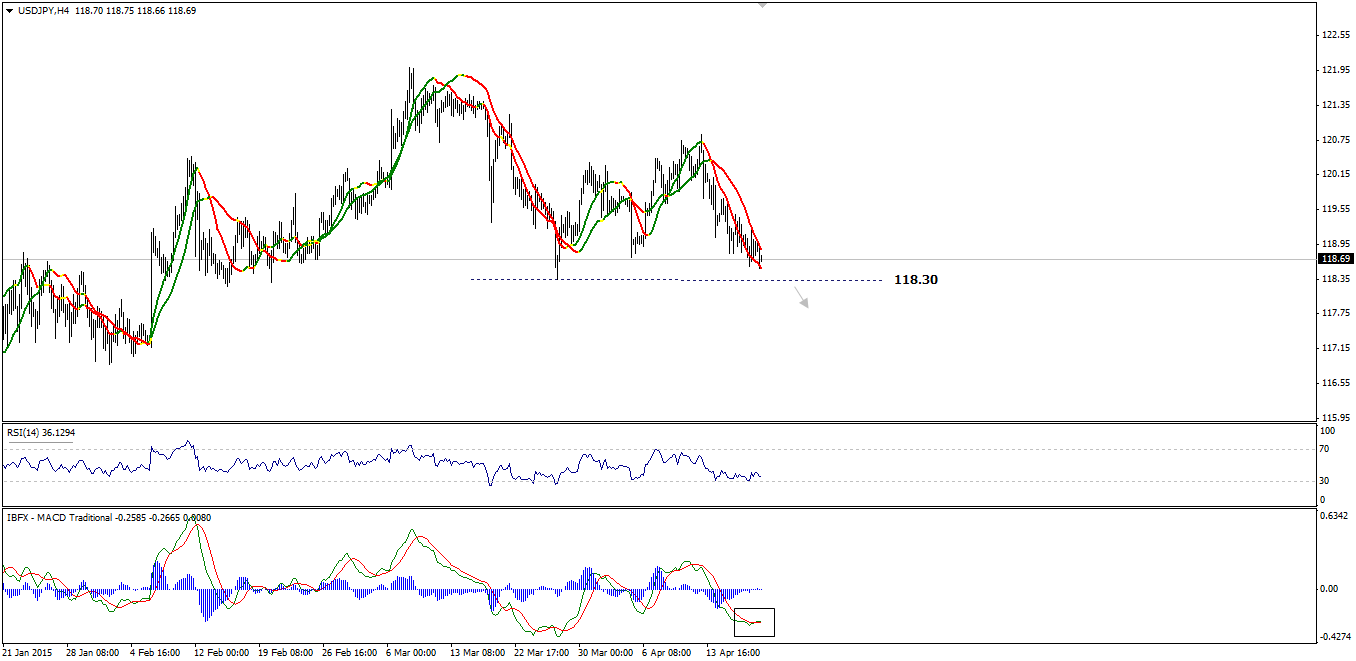
The pair has declined and it is gradually approaching the key support line at 118.30. However, we can’t join bears unless it clears this level to affirm beating the oversold signs on momentum indicators. A break below this level will clear the path towards 116.80-key short-term support- and therefore, we will remain on the sidelines, while placing a sell stop order below this level.

USD/CHF - Technical Report
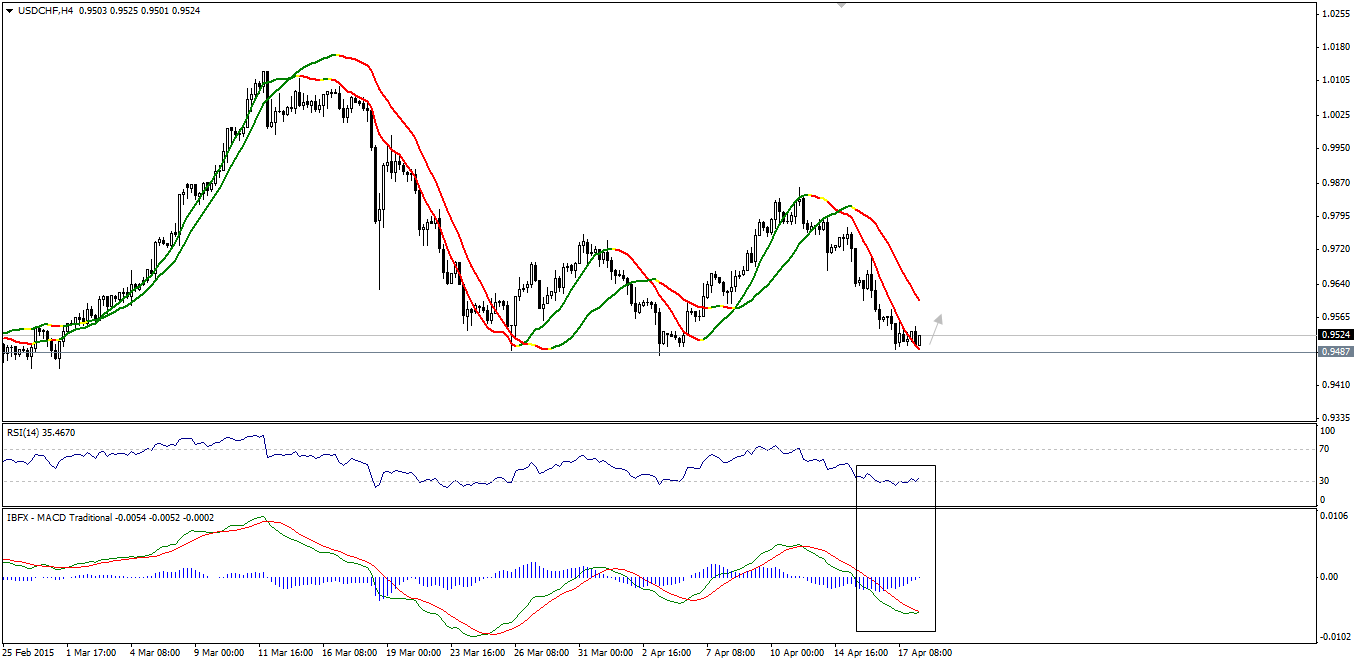
After approaching our second technical objective at 94.80, the pair has moved slightly upwards protected by the horizontal support seen on the provided graph. Oversold sign on RSI14 in addition to the bullish crossover on MACD may assist traders to build a new intraday base. To recap, we will be bullish as far as 0.9480 holds, while buying interests could start with a break above 0.9550.

USD/CAD - Technical Report
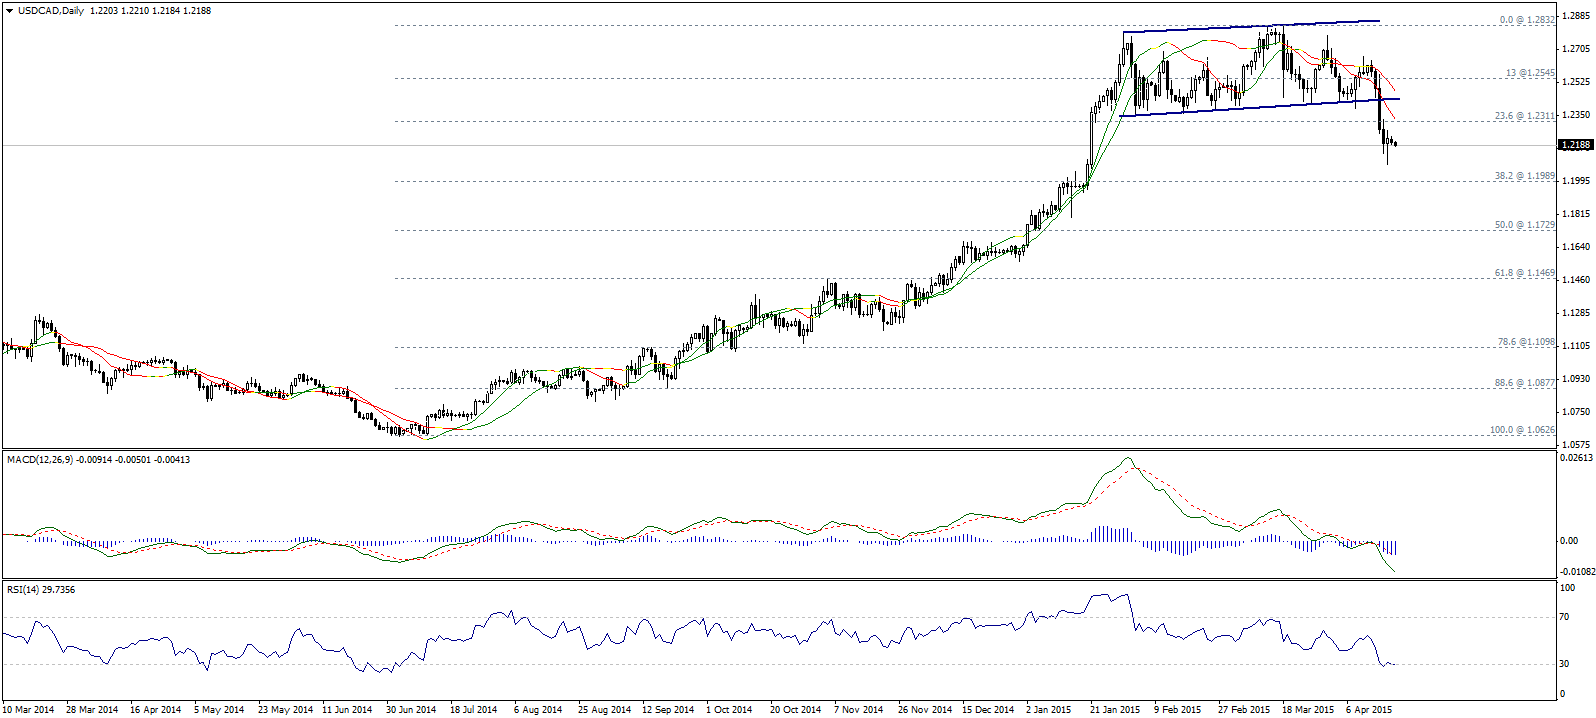
Although the slight recovery during Friday’s trading, the pair is trading below 1.2310, and any trading below that level will keep a high probability for more bearishness. We are targeting 38.2% Fibonacci correction located at 1.1990.
MACD indicator and linear regression indicators are negative, and that support our bearish view. For the intraday traders, trading below 1.2275 is needed to keep a higher probability for another sharp down movement.

AUD/USD - Technical Report
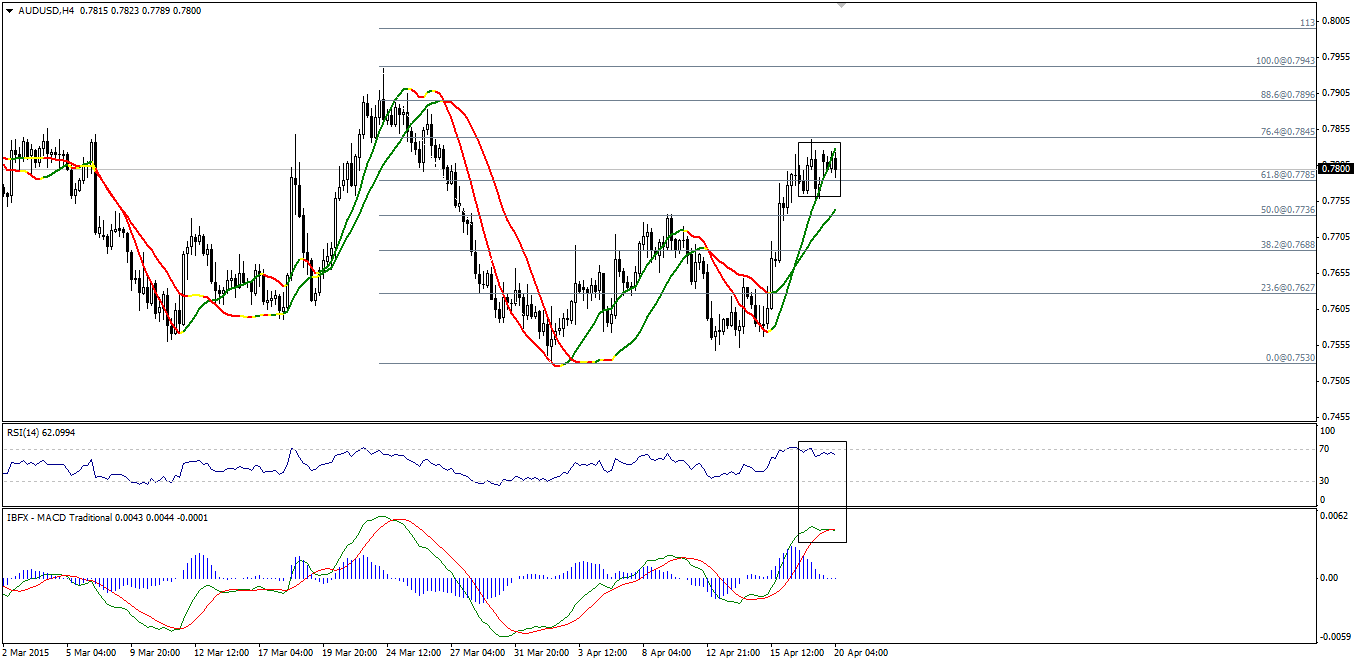
The pair has moved to the upside in line with our previous bullish expectations .Areas of 76.4% Fibonacci retracement has stopped the bullishness seen in the previous sessions, while indicators started to show signs of weakness as seen on the provided four-hour chart. A break below will be a negative catalyst, while clearing 0.7735 will cause panic sell-off actions. Anyway, we will bear bearish as far as 0.7895 holds.

NZD/USD - Technical Report
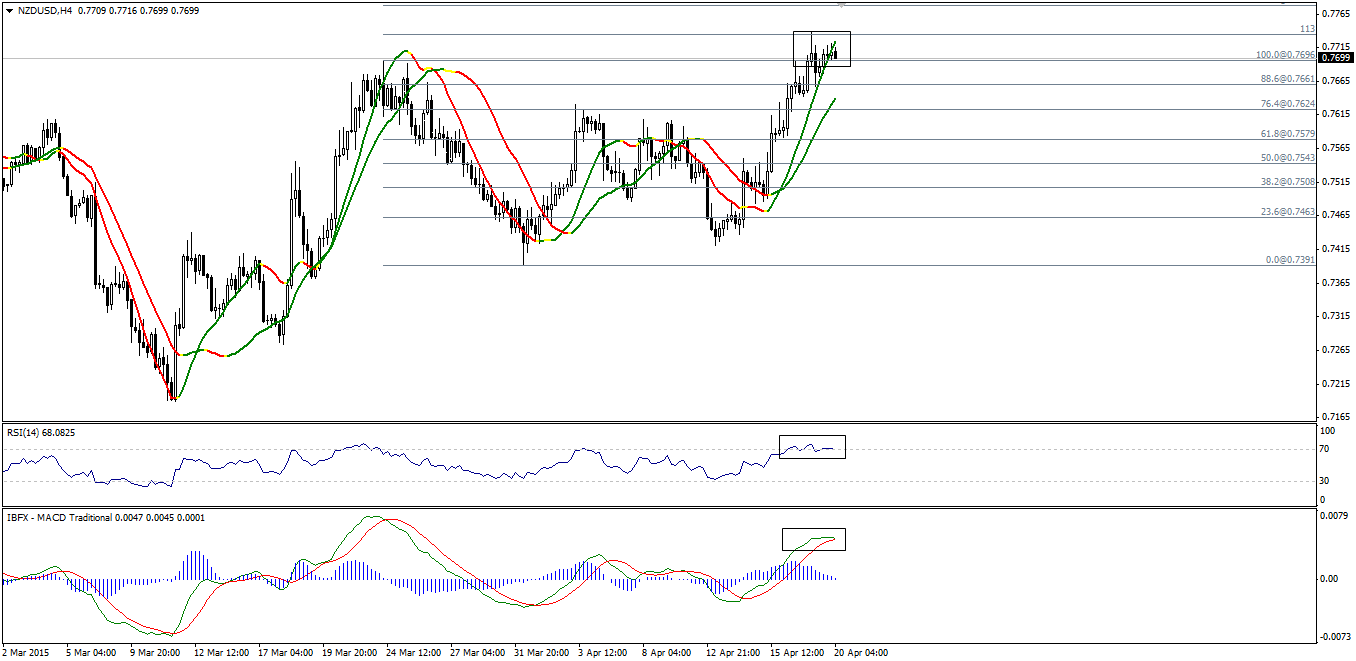
The pair has moved upwards, respecting our previous suggested bullish scenario and it traded near targets of 0.7765. Now, signs of trend exhaustion started to appear on technical indicators as seen on the provided four-hour graph. A break below 0.7660 will be a sign of placing a short-term top. To conclude, we will be bearish aiming to use overbought signs on momentum indicators.

