CNN ran a succinct article on Tuesday summarising the situation with the Greece-Eurogroup deal currently in the works. It's headline said: 'Greece's new rescue plan is deeply flawed.'
Here are the key points:
1. "... too much emphasis on raising taxes and pension contributions, and not enough on cutting spending or making the economy more flexible."
2. " ... Greece won't grow fast enough, or generate big enough budget surpluses, to service its enormous debt any time soon -- even given the extremely low interest rates and deferred payment schedules attached to the international bailout loans."
3. "The final tranche of cash from the existing bailout should be enough to meet repayments due to the IMF and European Central Bank through the end of August. But the Greek government will then have to find more than two billion euros for both institutions in September and October. ... UBS estimates Greece may need additional funds of nearly 14 billion euros to carry it through to the end of 2015."
We have (supposedly) kicked the can down the road for a few months and will likely be revisiting this mess before the end of the year.
It was interesting to see the euro selloff sharply on the news of a potential deal with Greece. Some have suggested that this was due to markets refocusing on the US Fed, as a hawkish comment from the Fed's Jerome Powell started everyone thinking about the impending rate hike.
The reality however may be quite different. The euro is a great base currency for carry trades due to negative short-term rates in the Eurozone. With the risk-on signal flashing green, market participants jumped back into the carry trade, pushing the euro lower. 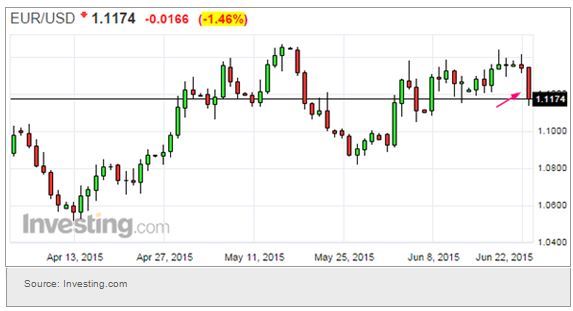
Economic data from the Eurozone continues to show improving fundamentals. The area's Markit Composite PMI beat projections. 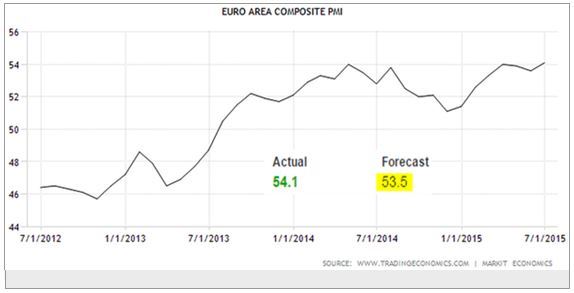
France, which has been lagging other euro area nations, is exhibiting economic momentum not seen there in years. 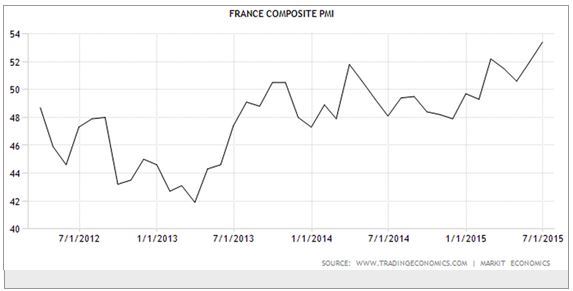
Switching to Asia, with the risk-on trade back on, Japan's Nikkei 225 hits a 15-year high. 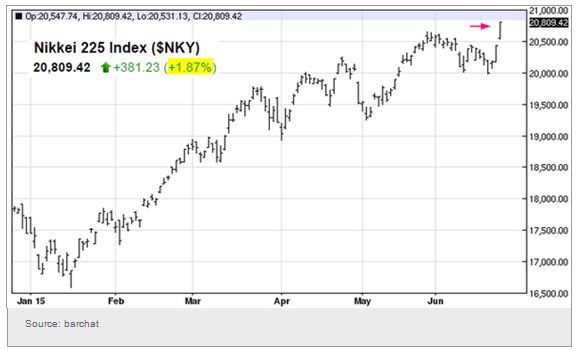
China's nominal GDP growth slowed more than the real GDP measure, implying that the GDP deflator used was negative. While inflation in China has certainly slowed, it's not yet negative.
This seems to be a convenient way to meet the official "target" growth rate. 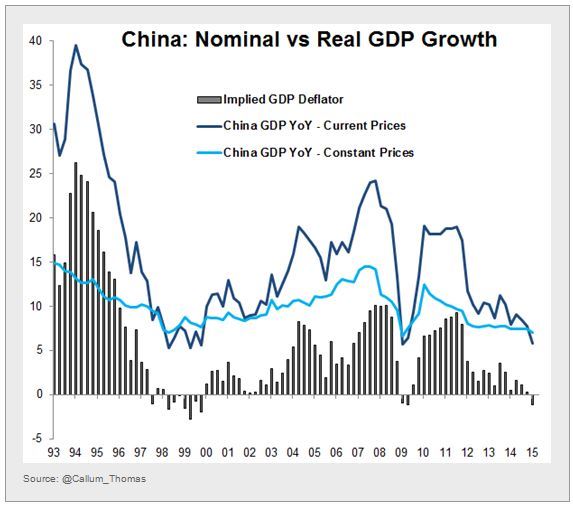
It seems that Russia has overtaken Saudi Arabia as the top supplier of crude oil to China. With the ruble devalued, Russia can undercut a number of producers to gain market share. 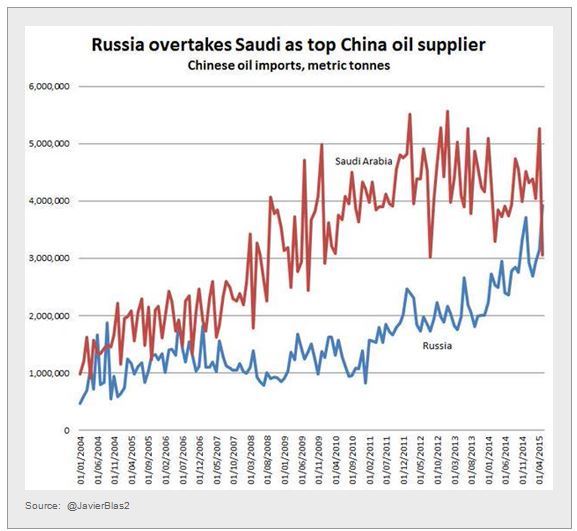
Here is a quick look at central banks' balance sheets as a percentage of the nations' GDP. Switzerland is still the highest, with the Swiss National Bank holding massive amounts of euros and euro-denominated securities. 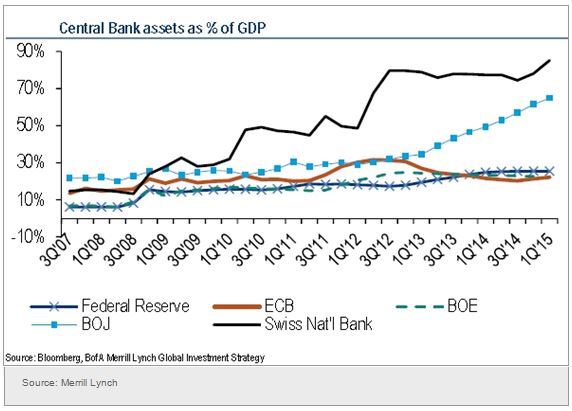
In spite of this record level of monetary expansion the Swiss franc remains quite strong vs. the euro since the SNB removed the cap on its currency (the chart below shows the euro remaining weak against the Swiss franc). This has resulted in worse than expected deflationary pressures in Switzerland. 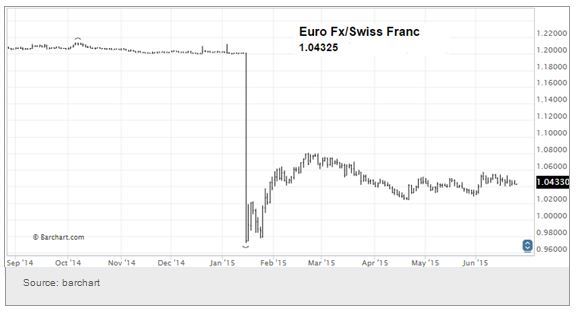
Dallas Fed researchers produced a breakdown of the US dollar appreciation since 2011. Apparently the appreciation was driven by five trading partners. 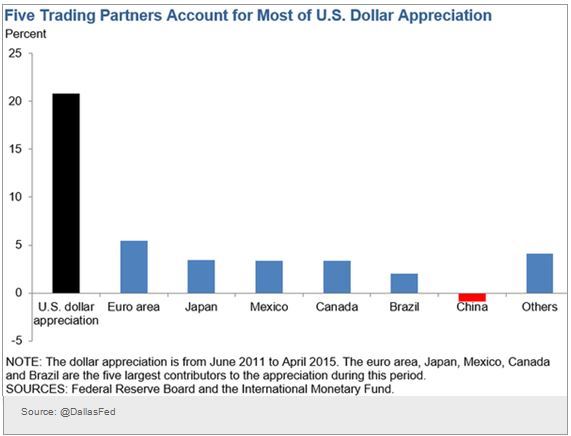
Now some trends in fixed income and equity markets I am tracking:
1. VIX may revisit the 2014 lows as the market seems to be ignoring the Fed - for now. 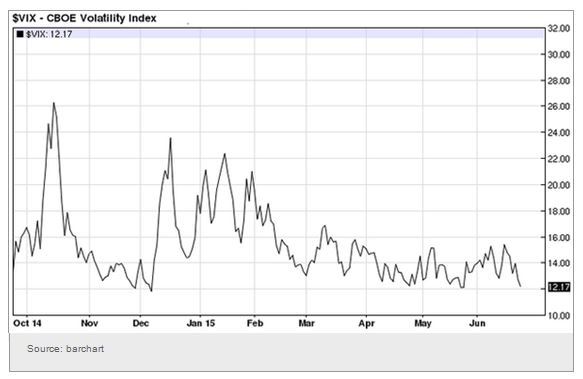
2. US bank shares are still outperforming the broader market on steeper yield curve, stronger housing market, and the supposed resolution with Greece. 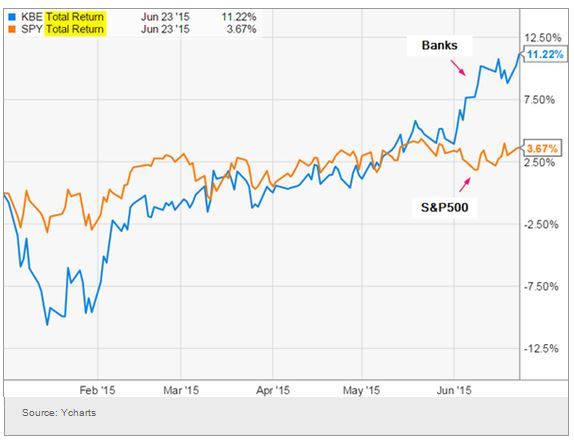
3. Small caps continue to outperform as well. 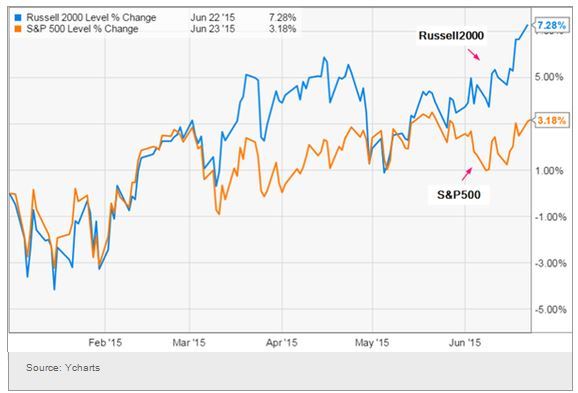
4. Higher rates are pressuring high dividend shares. 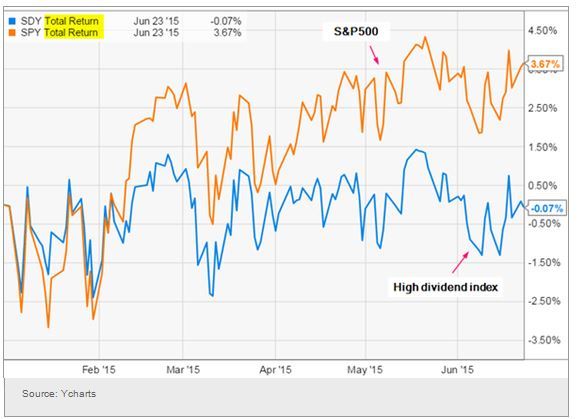
Now some food for thought: How many years did it take for a quarter of the US population to adopt new technologies? 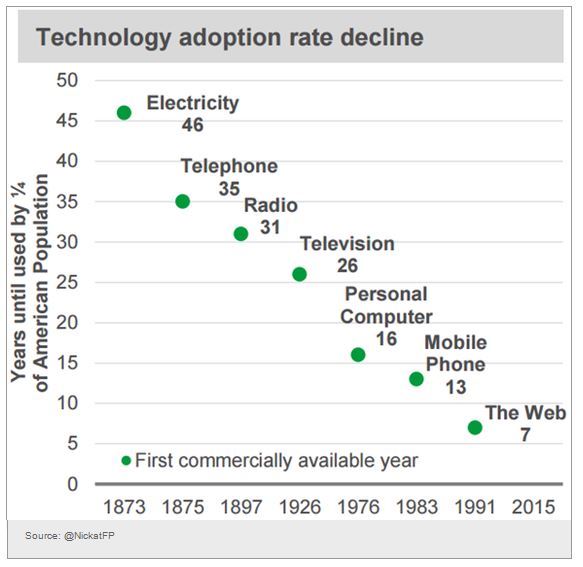
Disclosure: Originally published at Saxo Bank TradingFloor.com
