- Manufacturing malaise spreads to services sector
- Raft of PMIs undershoot consensus expectations
- Weakness particularly severe in Brazil
- India corporate earnings optimism may be excessive
- US diesel and natural gas prices slump
Today let's take a look at the global service sector. We've seen manufacturing weakening across the board, but now there are signs of trouble in non-manufacturing sectors. To be sure, services activity continues to expand, but the pace of growth has disappointed recently. Most major economies printed September service PMIs that were below consensus.
1. In the United States, the ISM NMI (non-manufacturing) came in at 56.9 vs. 57.5 expected. New orders were especially soft.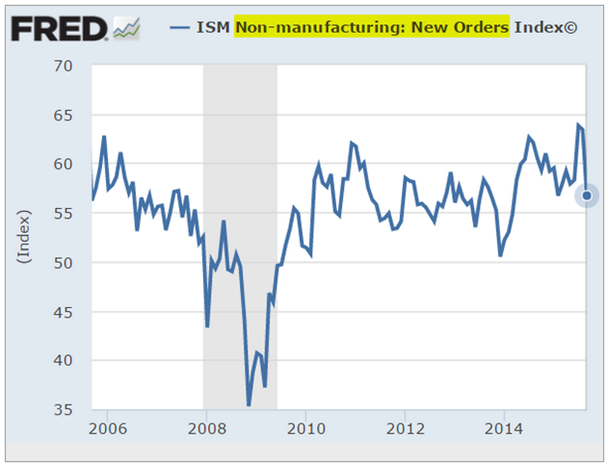
2. We've already seen this China services chart last week.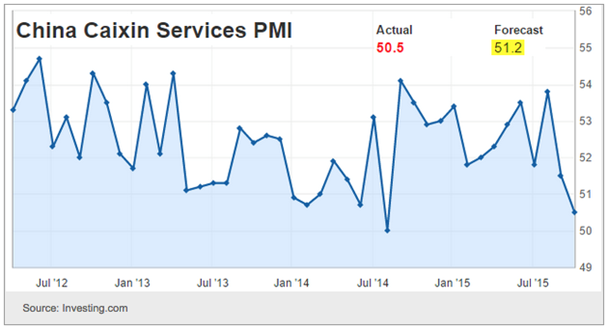
3. Here is the UK service PMI - significantly below consensus.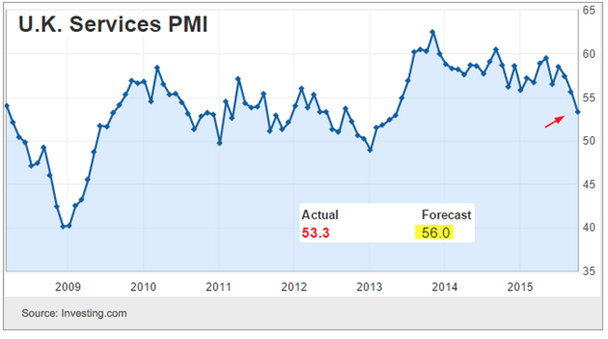
And more headlines ...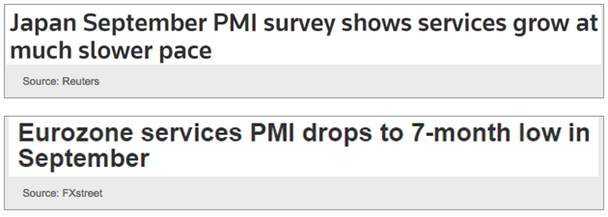
Even Spain, which has had solid growth recently, is experiencing a slowdown in its service sector.
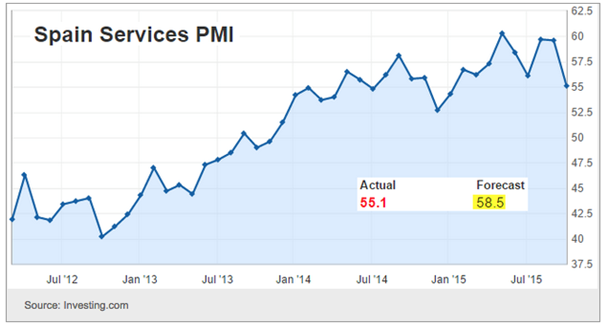
This is telling us that the global slowdown is not limited to manufacturing. Here is JPMorgan (NYSE:JPM) commenting on the latest Markit Service PMI survey report.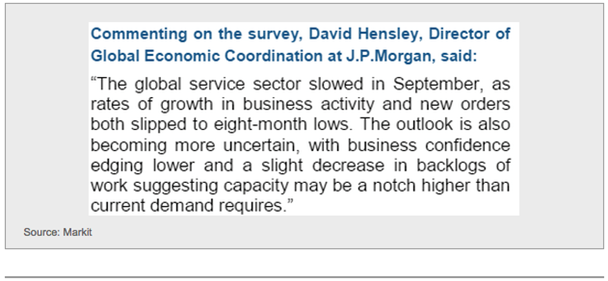
Speaking of economic slowdowns, here is a good description of the situation on Brazil.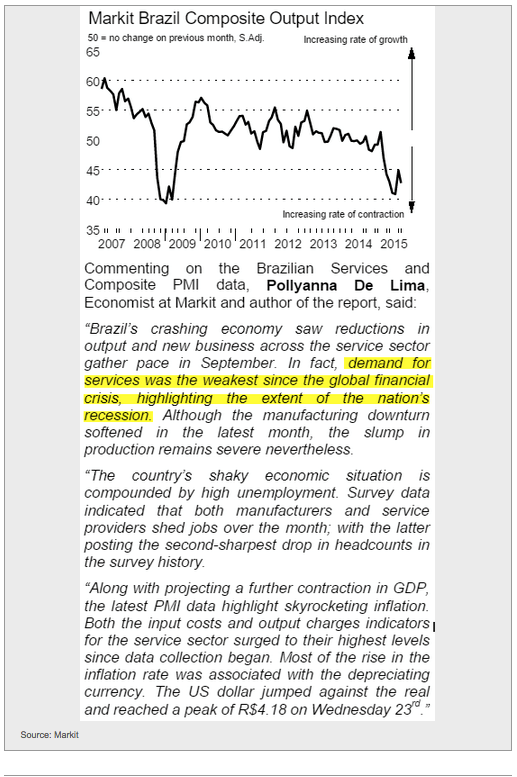
In India, we see corporate earnings growth forecasts far exceeding those in the rest of Asia. Are analysts too optimistic on India?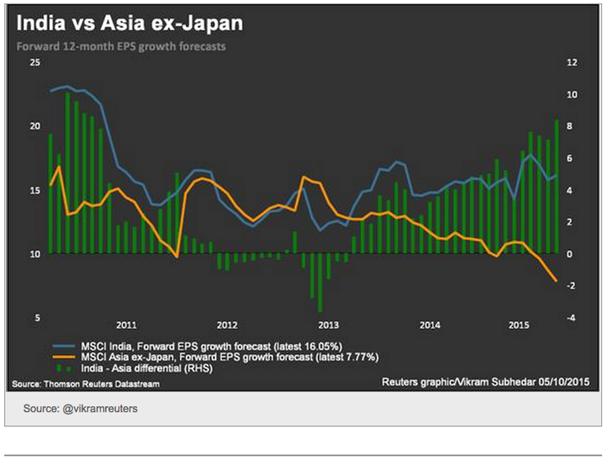
China's currency usage in settling international transactions continues to grow. That's one of the reasons Beijing is so concerned about the RMB stability. A sharp devaluation (and the volatility that could generate) at this point could slow these gains in usage.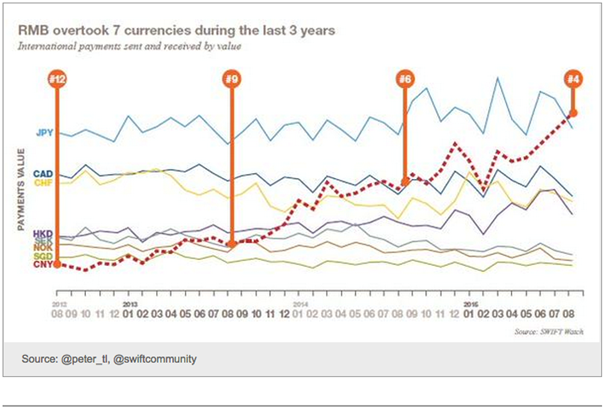
Colombian inflation jumped to a 6-yr high, exceeding economists' forecasts. Much of this has been driven by the drought (pushing food prices higher) as well as extreme weakness in the peso. 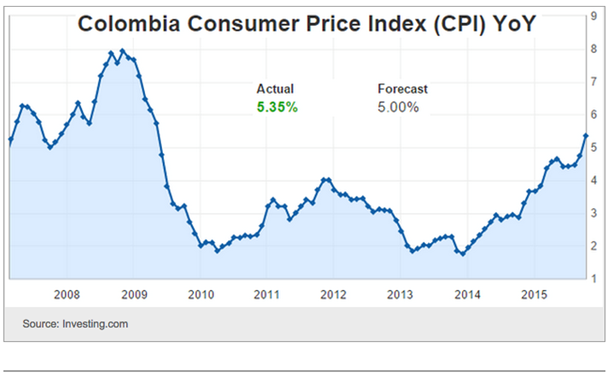
Australia's central bank held rates steady at 2% in spite of recent economic weakness. The Australian dollar jumped in response. The Reserve Bank of Australia is preparing for the Fed's rate hike, which in theory should weaken AUD - a form of stimulus. In effect, the RBA wants the Fed to do the "work" for them. The RBA, however, may have to wait a while...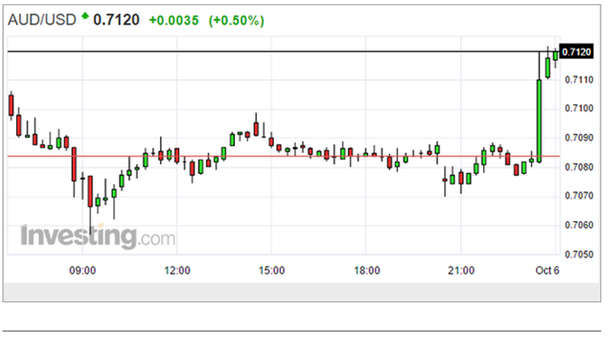
Now let's take a look at a number of developments in the commodities markets.
1. Apparently Russia is losing patience with Opec's policy of expanding production and pressuring crude prices. It is costing Russia dearly. Russian officials indicated they are ready to meet Opec to discuss oil prices. Energy prices jumped on the report. Here is the US gasoline futures contract.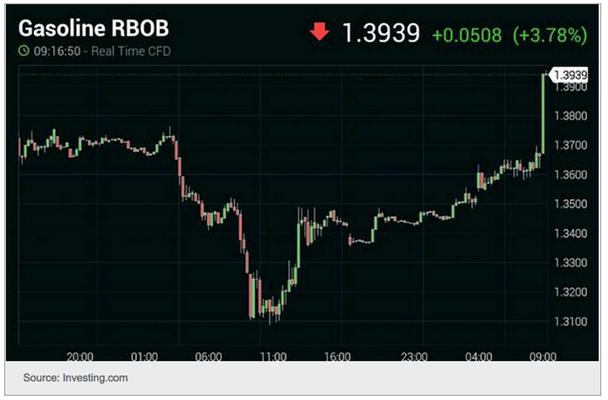
2. On the other hand, US diesel prices continue to fall on global oversupply.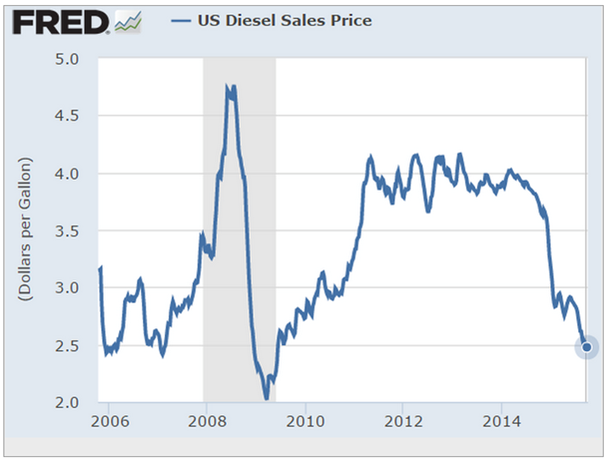
3. Natural gas prices have been declining for some time now as production spiked. Warmer than expected weather (and forecasts) have not helped.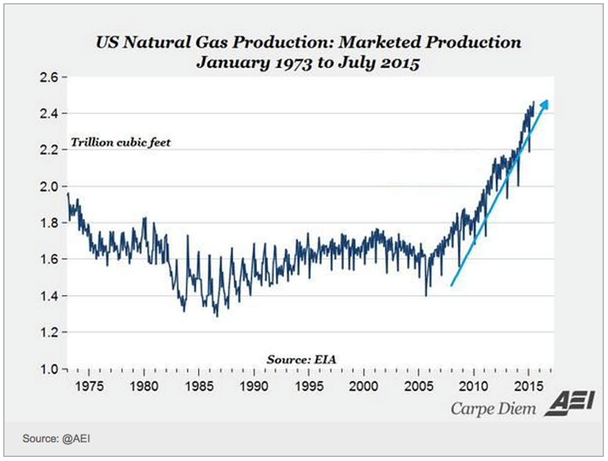
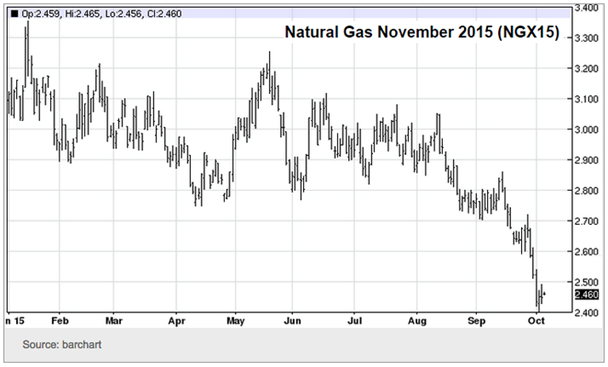
As a result, natural gas positioning by speculative futures accounts show a record net short position. A few cold days is all it would take to put a short squeeze here.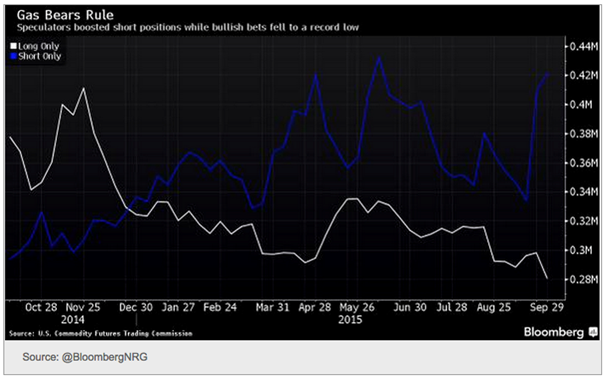
4. Precious metals are responding to the halt in US dollar rally as the Fed hike expectations get pushed out. Here is silver.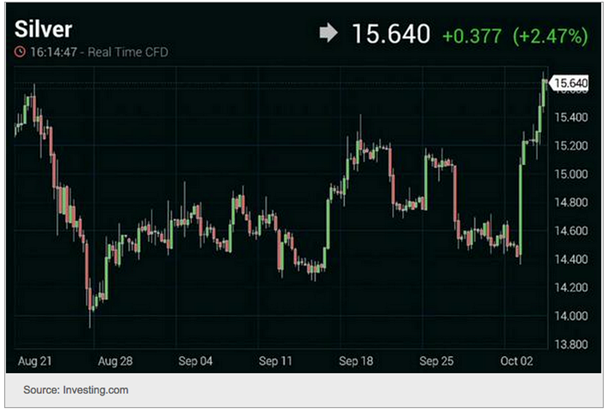
5. As discussed yesterday, other commodities where we've seen significant speculative shorts building up may see sharp reversals. Below is the December coffee futures contract.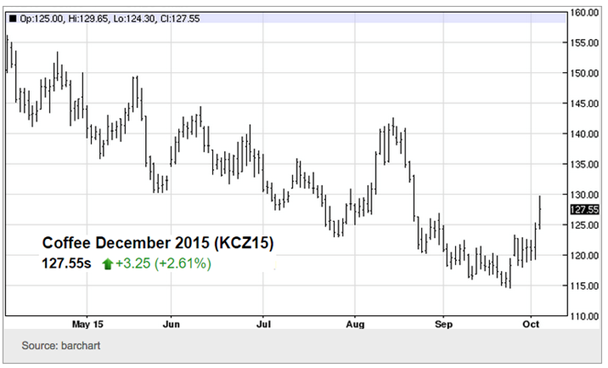
6. Glencore (LONDON:GLEN) experienced the strongest share price jump in its history on takeover speculation and potential stability in copper prices. Or was the copper price driven by Glencore?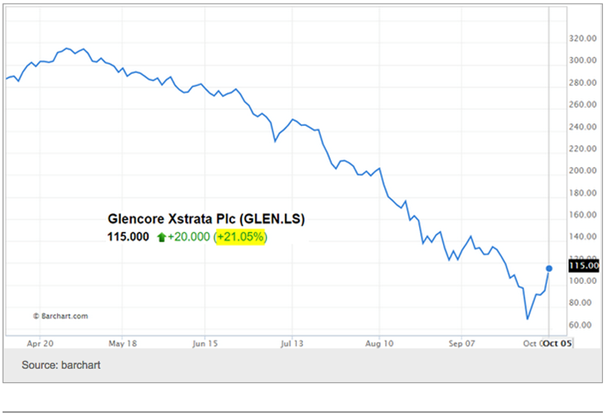
Disclosure: Originally published at Saxo Bank TradingFloor.com
