EUR/USD
The Euro continues to trend lower and looks for retest of key support and near-term target at 1.35 base, to complete 1.3502/1.3699 ascend. The third wave, which commenced from 1.3649 lower top, met its 100% Fibonacci expansion at 1.3520, where the pair entered consolidative phase, ahead of final push to 1.3502 low. Overall negative structure sees scope for further extension of larger down move off 1.3699 peak, with the wave expected to extend to 1.3475/70, 03 Feb higher low / Fibonacci 138.2% expansion and 1.3440, 161.8% expansion. Stronger corrective actions should find good barrier at 1.3570, previous lows zone / lower platform / 50% retracement of 1.3639/1.3519 downleg.
Res: 1.3532; 1.3560; 1.3572; 1.3585
Sup: 1.3519; 1.3502; 1.3470; 1.3440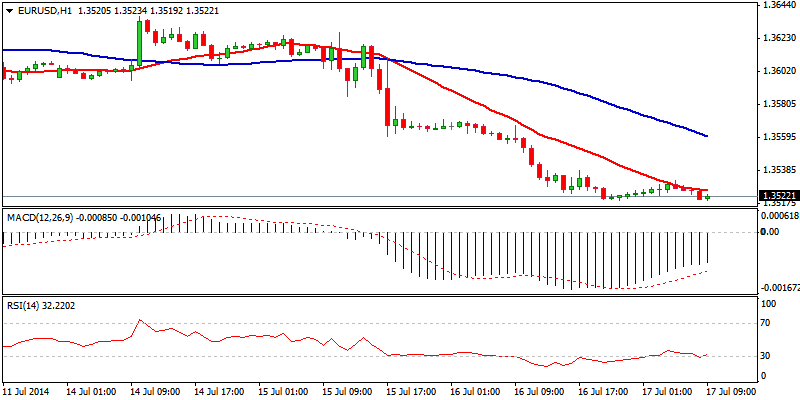
EUR/JPY
Near-term structure remains weak, as reversal from 138.43, recovery peak, eventually broke below 137.48 low of 10 July, where the pair found temporary support for 137.48/138.43 corrective rally. Bears are back in rails and aim towards near-term target at 136.21, 04 Feb lower, return to which to mark completion of 136.21/143.78 bull-phase. Interim support lies at psychological 137 level, where the price is likely to take a breather and consolidate oversold conditions, before fresh push lower. Previous lows at 137.48/70 zone, now act as initial resistances, while stronger rallies should stay capped under 138 barrier, Fibonacci 61.8% of 138.45/137.21 descend, to keep bears in play.
Res: 137.48; 137.70; 138.07; 138.43
Sup: 137.21; 137.00; 136.74; 136.21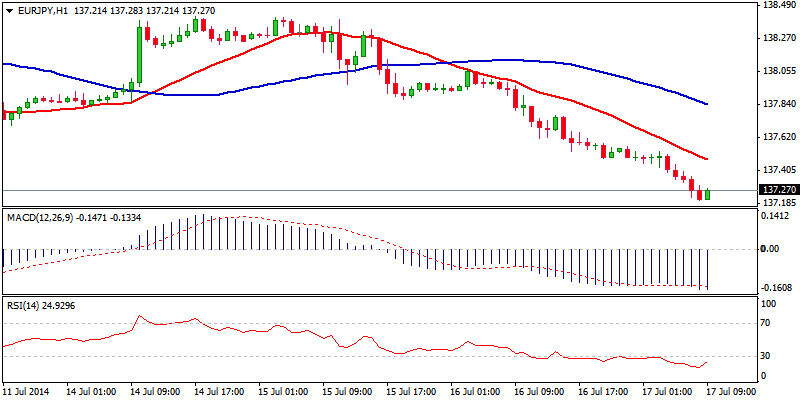
GBP/USD
Cable trades in extended corrective phase off fresh high at 1.7189, after strong recovery rally failed to sustain gains above previous high and resume larger uptrend. Further sideways trading, shown on larger timeframes, seems to be likely scenario, as the pair failed to capitalize on 15 July strong rally and change of direction, signaled by outside day candle. Near-term structure is weakening, as the price so far dipped to the levels close to 1.71 support, previous breakpoint and Fibonacci 61.8% retracement of 1.7057/1.7189 upleg. Break here to confirm negative near-term stance and re-focus lower range levels. However, daily structure remains firmly bullish and sees fresh attempts higher favored, once corrective action is over. Fresh low at 1.7057 is expected to hold and prevent the pair from more significant pullback.
Res: 1.7149; 1.7166; 1.7189; 1.7200
Sup: 1.7111; 1.7089; 1.7068; 1.7057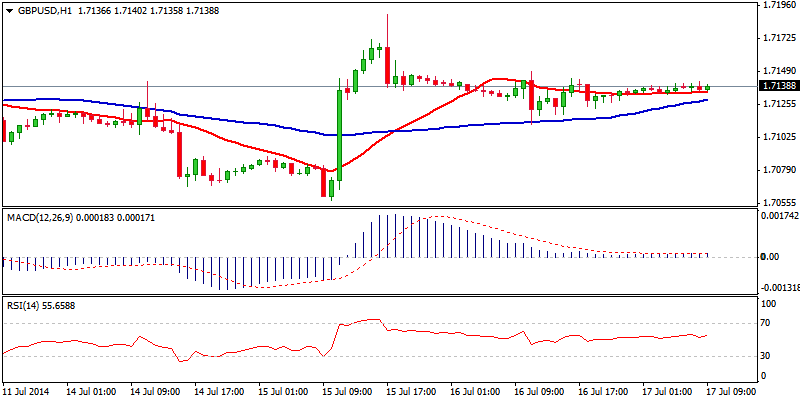
USD/JPY
The pair corrects recent rally that peaked at 101.78, with dips being so far contained at 101.44, just above 15 July spike low and 50% retracement of 101.05/101.78 upleg, where corrective actions should ideally reverse. Reversing hourly RSI and positive 4-hour structure supports such scenario and sees scope for eventual attempt through pivotal 101.85, 09 July high / psychological 102 barrier, also daily cloud base, break of which to confirm bullish resumption and open next breakpoints at 102.25/35. Alternatively, loss of 101.40/30 support zone, current lows and Fibonacci 61.8% / previous consolidation tops, to bring bears back in play for possible return to 101 support zone.
Res: 101.61; 101.78; 101.85; 102.00
Sup: 101.44; 101.33; 101.20; 101.05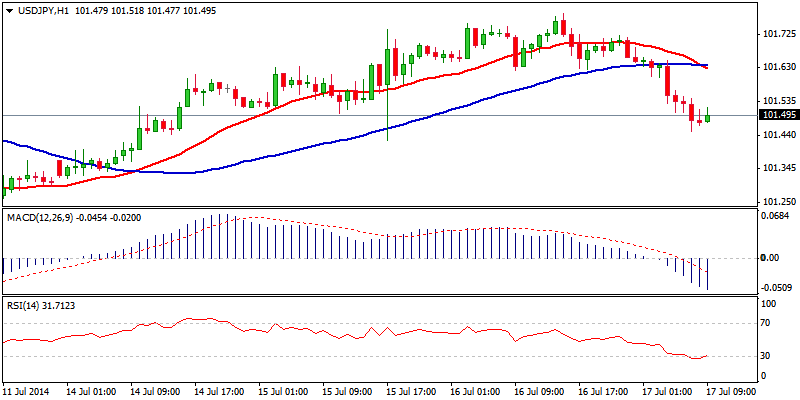
AUD/USD
The pair remains under pressure as near-term recovery attempt off 0.9327, 03 July low, lost traction after spiking at 0.9454 and subsequent weakness fully retraced 0.9327/0.9454 upleg. This brought immediate risk at key 0.9320 higher platform and Fibonacci 61.8% retracement of 0.9209/0.9503 ascend, with break here to trigger fresh extension of reversal from 0.9503 peak, which was interrupted by 0.9327/0.9454 corrective rally. Negative near-term studies support further weakness, however, hesitation ahead of 0.9320 base could be expected, as hourly studies are oversold. Corrective rallies should stay under 0.94 barrier, to keep fresh bears intact.
Res: 0.9396; 0.9407; 0.9429; 0.9454
Sup: 0.9327; 0.9320; 0.9300; 0.9250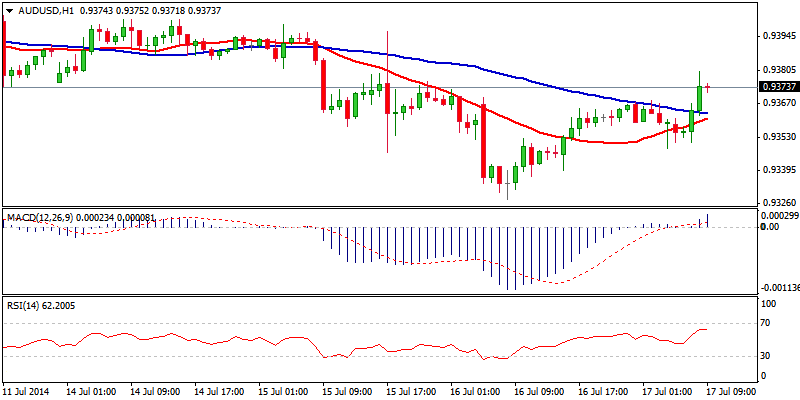
AUD/NZD
The pair trades in near-term corrective phase mode, after bears found support at 1.0619 and recovery attempts left higher low at 1.0637, before rallying. Upside acceleration broke above initial barriers at 1.0730/50, turning near-term structure bullish for stronger recovery. Near term targets at psychological 1.08 barrier and 1.0834, 02 July lower top, are in focus, however, rallies may be delayed as near-term studies entered overbought territory, with no reversal signal shown yet. Corrective dips should be ideally contained at /above 1.0730, previous barrier and higher base.
Res: 1.0785; 1.0800; 1.0834; 1.0850
Sup: 1.0753; 1.0730; 1.0700; 1.0670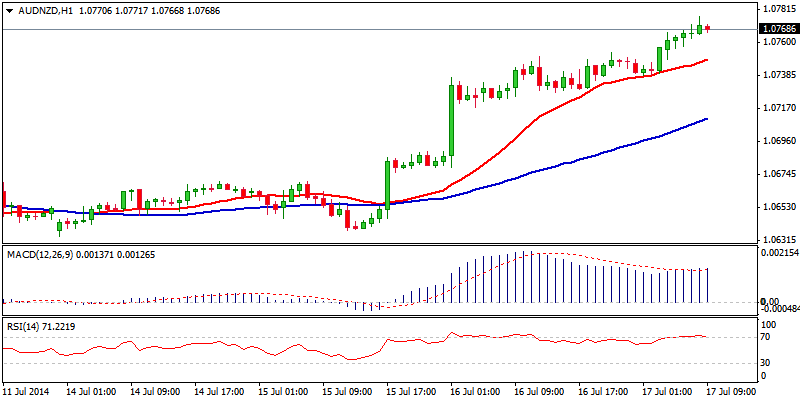
XAU/USD
Spot Gold trades in near-term corrective phase after fresh bearish acceleration eventually broke below psychological 1300 support and found ground at 1292, mid-point of 1240/1344 rally. Corrective actions probe above psychological 1300 barrier and test previous support and lower top at 1313, also Fibonacci 38.2% retracement of 1344/1292 descend, where rallies should be ideally capped, not to further delay bears that prevail on 4-hour and daily timeframes.
Res: 1308; 1313; 1318; 1324
Sup: 1300; 1292; 1286; 1280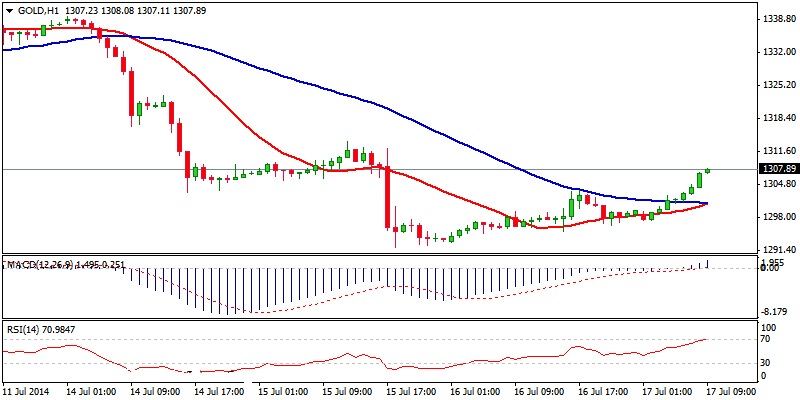
- English (UK)
- English (India)
- English (Canada)
- English (Australia)
- English (South Africa)
- English (Philippines)
- English (Nigeria)
- Deutsch
- Español (España)
- Español (México)
- Français
- Italiano
- Nederlands
- Português (Portugal)
- Polski
- Português (Brasil)
- Русский
- Türkçe
- العربية
- Ελληνικά
- Svenska
- Suomi
- עברית
- 日本語
- 한국어
- 简体中文
- 繁體中文
- Bahasa Indonesia
- Bahasa Melayu
- ไทย
- Tiếng Việt
- हिंदी
Daily Market Outlook: Euro Trends Lower, Gold Finds Ground At 1292
Published 07/17/2014, 05:12 AM
Updated 02/21/2017, 08:25 AM
Daily Market Outlook: Euro Trends Lower, Gold Finds Ground At 1292

FinFX
3rd party Ad. Not an offer or recommendation by Investing.com. See disclosure here or
remove ads
.
Latest comments
Install Our App
Risk Disclosure: Trading in financial instruments and/or cryptocurrencies involves high risks including the risk of losing some, or all, of your investment amount, and may not be suitable for all investors. Prices of cryptocurrencies are extremely volatile and may be affected by external factors such as financial, regulatory or political events. Trading on margin increases the financial risks.
Before deciding to trade in financial instrument or cryptocurrencies you should be fully informed of the risks and costs associated with trading the financial markets, carefully consider your investment objectives, level of experience, and risk appetite, and seek professional advice where needed.
Fusion Media would like to remind you that the data contained in this website is not necessarily real-time nor accurate. The data and prices on the website are not necessarily provided by any market or exchange, but may be provided by market makers, and so prices may not be accurate and may differ from the actual price at any given market, meaning prices are indicative and not appropriate for trading purposes. Fusion Media and any provider of the data contained in this website will not accept liability for any loss or damage as a result of your trading, or your reliance on the information contained within this website.
It is prohibited to use, store, reproduce, display, modify, transmit or distribute the data contained in this website without the explicit prior written permission of Fusion Media and/or the data provider. All intellectual property rights are reserved by the providers and/or the exchange providing the data contained in this website.
Fusion Media may be compensated by the advertisers that appear on the website, based on your interaction with the advertisements or advertisers.
© 2007-2024 - Fusion Media Limited. All Rights Reserved.