EUR/USD
The euro resumes descend after completing near-term consolidation above 1.0711, yesterday’s low, where the price fell after rejection on approach to 1.0847, last Friday’s recovery top. Near-term studies are losing traction and fresh weakness below1.07 breakpoint zone, reinforced by daily 10SMA, is triggering further easing towards 1.0644, Fibonacci 61.8% retracement of 1.0519/1.0847 upleg, ahead of 1.0622, 16 Apr trough. Bearish Engulfing pattern that was formed on yesterday’s negative close, as well as daily close below daily 1.07 handle, support negative scenario. Initial barriers now lay at 1.07 zone, ahead of session high at 1.0748 and daily Kijun-sen at 1.0785
Res: 1.0700; 1.0748; 1.0767; 1.0800
Sup: 1.0644; 1.0622; 1.0600; 1.0569 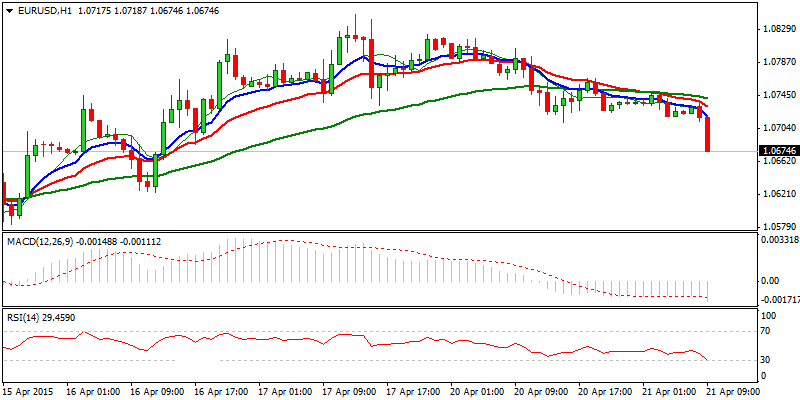
EUR/JPY
Overall picture remains negative, as recovery attempts were rejected under descending daily 20SMA, with yesterday’s bearish Outside Day and close below falling daily 10SMA, supporting the notion. On the other side, near-term studies are in neutral mode, as the price consolidates above 126.58, yesterday’s reversal low. While the latter holds, hopes of renewed attempts higher, will remain in play, with regain of recovery high at 128.75, required to signal resumption of near-term recovery from 126.08, low of 14 Apr. Otherwise, violation of pivotal 127.58 low, to signal further retracement of 126.08/128.75 upleg.
Res: 128.28; 128.45; 128.75; 129.29
Sup: 127.89; 127.58; 127.10; 126.73 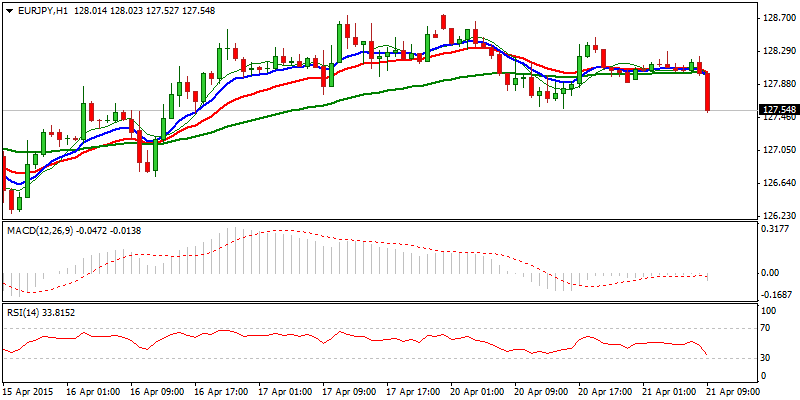
GBP/USD
Cable is at the back foot and extends reversal after failure to hold gains above pivotal 1.50 barrier. Today’s fresh weakness approaches initial support of daily Kijun-sen line at 1.4862, with break here to open pivotal support at 1.4830, sideways-moving daily 20SMA. Yesterday’s close in red and reversing daily stochastic, support the notion, with close below daily 20SMA, required to confirm and expose 1.48, round-figure support and 1.4750, Fibonacci 61.8% retracement of 1.4563/1.5051 upleg. Session high at 1.4910 marks initial resistance, ahead of yesterday’s high at 1.4982, above which to shift near-term focus higher.
Res: 1.4910; 1.4982; 1.5008; 1.5051
Sup: 1.4854; 1.4830; 1.4800; 1.4750 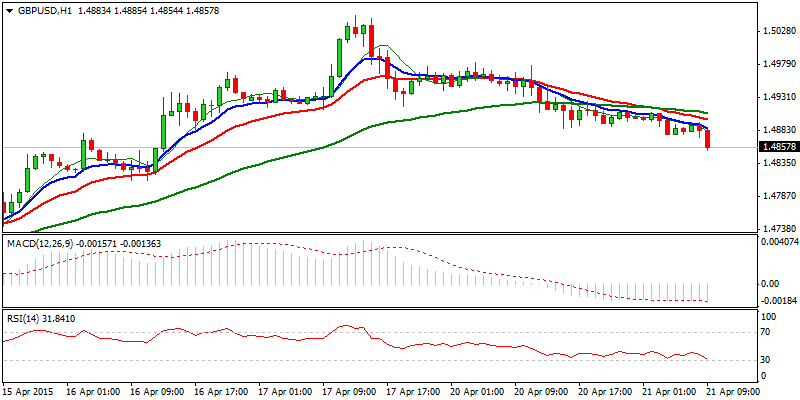
USD/JPY
The pair is regaining traction after bouncing from yesterday’s low at 118.52, where descend towards key 118.31 support found temporary support. Yesterday’s positive close and today’s fresh strength above 119.40, Fibonacci 38.2% retracement of 120.83/118.52, sidelines immediate downside risk, as the rally approaches pivotal barrier at 119.59, daily 20SMA, break of which to accelerate recovery for possible attack at next trigger at 120.00. However, negative tone prevails on daily studies and regain of 120 handle is required to confirm near-term bottom and expose the upper boundary of 118.31/120.83 range.
Res: 119.59; 119.67; 119.95; 120.28
Sup: 119.12; 118.95; 118.52; 118.31 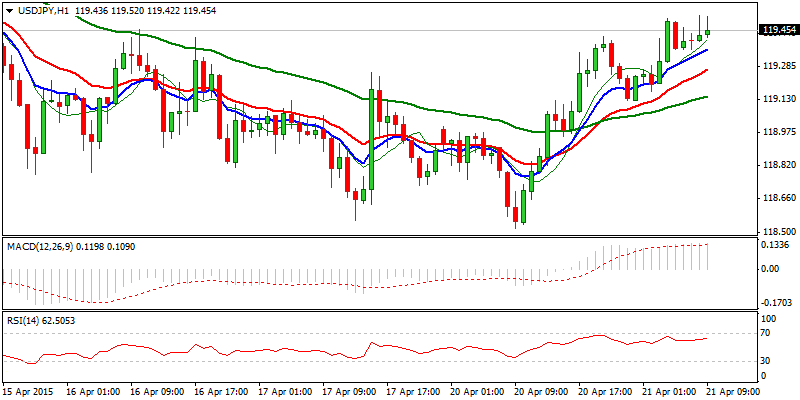
AUD/USD
The pair comes under pressure, following yesterday’s upside rejection that left hourly lower platform at 0.7825, with fresh acceleration lower, ending day in long red candle. Today’s fresh weakness and price action established below daily cloud base, attacking daily 20SMA at 0.7683, confirm negative near-term stance. Close below daily 20SMA and loss of 0.7663, Fibonacci 61.8% retracement of 0.7553/0.7841, to signal possible return to 0.7553, 14 Apr higher low. Daily Kijun-sen line reinforces initial barrier and session high at 0.7726, ahead of 0.7757, former consolidation floor and 0.7770, Fibonacci 61.8% of 0.7825/0.7681, regain of which to sideline downside pressure.
Res: 0.7726; 0.7757; 0.7770; 0.7825
Sup: 0.7681; 0.7663; 0.7621; 0.7570 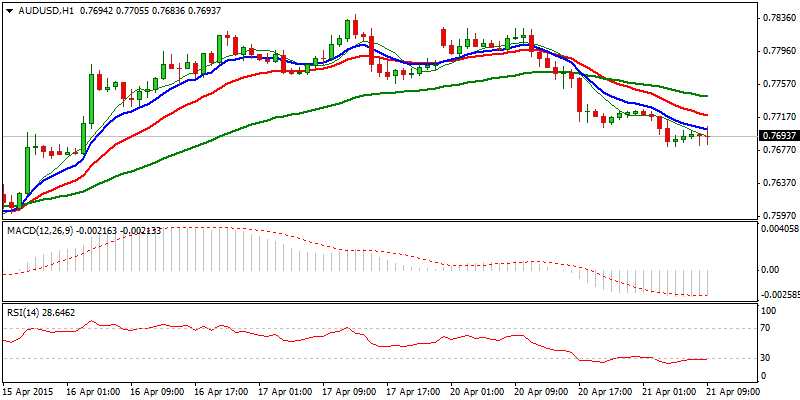
AUD/NZD
The cross remains under pressure and continues to move lower, after leaving lower top at 1.0152, yesterday’s high. Yesterday’s long red candle and close below 1.01 support, maintains bearish pressure for return to 1.0016, 06 Apr low, with completion of 1.0016/1.0217 corrective phase, expected to open key support at parity level, loss of which to accelerate larger bears into uncharted territory. Yesterday’s high at 1.0152, reinforced by daily 20SMA, marks pivotal barrier and only break here would sideline immediate downside risk.
Res: 1.0090; 1.0137; 1.0152; 1.0200
Sup: 1.0045; 1.0016; 1.0000; 0.9950 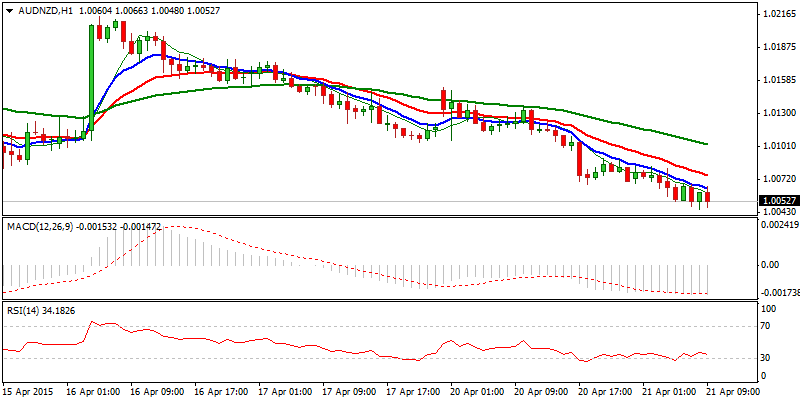
XAU/USD
Spot gold came under pressure after repeated rejection to break above pivotal 1209 barrier, with subsequent acceleration lower, ending yesterday’s trading in red and closing below psychological 1200 support, reinforced by daily 20SMA. Weakened near-term technicals see risk of further easing, with break below yesterday’s low at 1191, to open bull-trendline, connecting 1178/1183 lows at 1187, ahead of pivotal 1183/78, lows of 14 Apr / 31 Mar, loss of which is required to confirm reversal. Daily indicators are at the midlines and require break of either, 1187 or 1207, trendlines and boundaries of triangular consolidation, to signal fresh direction.
Res: 1196; 1200; 1207; 1209
Sup: 1191; 1187; 1183; 1178 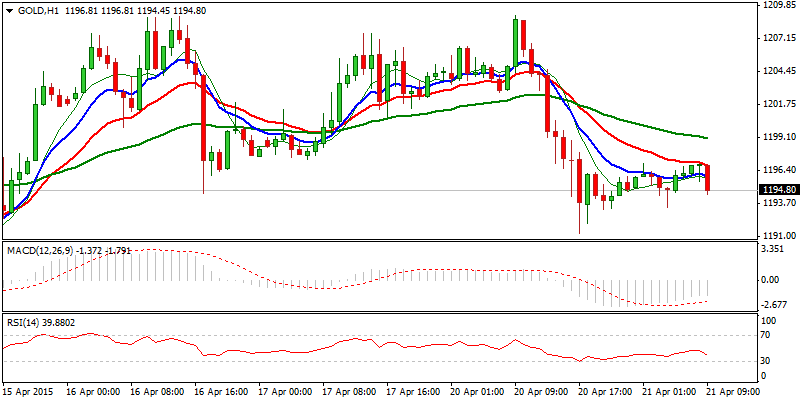
- English (UK)
- English (India)
- English (Canada)
- English (Australia)
- English (South Africa)
- English (Philippines)
- English (Nigeria)
- Deutsch
- Español (España)
- Español (México)
- Français
- Italiano
- Nederlands
- Português (Portugal)
- Polski
- Português (Brasil)
- Русский
- Türkçe
- العربية
- Ελληνικά
- Svenska
- Suomi
- עברית
- 日本語
- 한국어
- 简体中文
- 繁體中文
- Bahasa Indonesia
- Bahasa Melayu
- ไทย
- Tiếng Việt
- हिंदी
Tuesday's Market Outlook: EUR/USD, EUR/JPY, GBP/USD, USD/JPY
Published 04/21/2015, 04:25 AM
Updated 02/21/2017, 08:25 AM
Tuesday's Market Outlook: EUR/USD, EUR/JPY, GBP/USD, USD/JPY

FinFX
3rd party Ad. Not an offer or recommendation by Investing.com. See disclosure here or
remove ads
.
Latest comments
Install Our App
Risk Disclosure: Trading in financial instruments and/or cryptocurrencies involves high risks including the risk of losing some, or all, of your investment amount, and may not be suitable for all investors. Prices of cryptocurrencies are extremely volatile and may be affected by external factors such as financial, regulatory or political events. Trading on margin increases the financial risks.
Before deciding to trade in financial instrument or cryptocurrencies you should be fully informed of the risks and costs associated with trading the financial markets, carefully consider your investment objectives, level of experience, and risk appetite, and seek professional advice where needed.
Fusion Media would like to remind you that the data contained in this website is not necessarily real-time nor accurate. The data and prices on the website are not necessarily provided by any market or exchange, but may be provided by market makers, and so prices may not be accurate and may differ from the actual price at any given market, meaning prices are indicative and not appropriate for trading purposes. Fusion Media and any provider of the data contained in this website will not accept liability for any loss or damage as a result of your trading, or your reliance on the information contained within this website.
It is prohibited to use, store, reproduce, display, modify, transmit or distribute the data contained in this website without the explicit prior written permission of Fusion Media and/or the data provider. All intellectual property rights are reserved by the providers and/or the exchange providing the data contained in this website.
Fusion Media may be compensated by the advertisers that appear on the website, based on your interaction with the advertisements or advertisers.
© 2007-2024 - Fusion Media Limited. All Rights Reserved.