EUR/USD
The euro continues to move within near-term consolidative range, confirmed by the third consecutive Doji candle, however, near-term tone remains negatively aligned, as the pair posted marginally lower low at 1.1153 yesterday. Gradual descend focuses key short-term support at 1.1096, 26 Jan low, return to which to complete short-term 1.1096/1.1532 consolidative phase and signal resumption of larger downtrend towards psychological 1.1000 target. Widening daily 20d Bollingers suggest fresh action, with former base at 1.1260, reinforced by daily 10SMA, offering initial resistance, ahead of 1.1320, descending daily 20SMA, which is expected to cap stronger rallies.
Res: 1.1185; 1.1266; 1.1243; 1.1292
Sup: 1.1153; 1.1096; 1.1050; 1.1000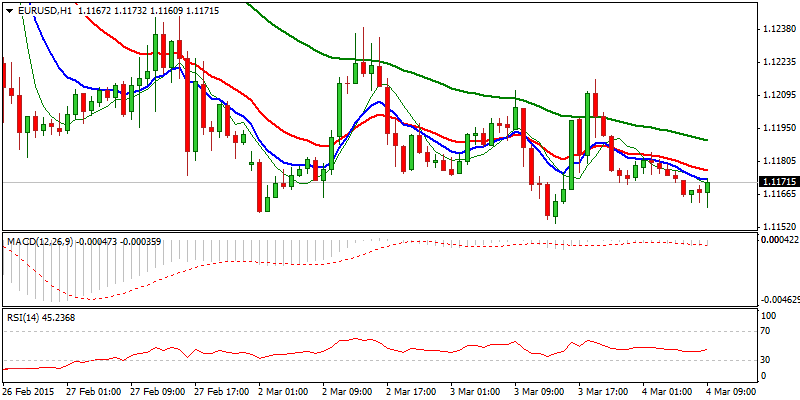
EUR/JPY
The cross maintains weak near-term tone and moves within bearish channel off 136.68 peak, following recovery rejection under daily 10/20SMA’s bear-cross and daily Tenkan-sen line at 134.70/80 zone. Subsequent easing probes below previous low at 133.66, with bearish tone being re-established on near-term studies, seeing risk of return to 133.40, last Friday’s low and 50% of 130.13/136.68 recovery rally and further easing on a break lower. Studies on larger timeframes remain bearish, with limited upside action seen while daily 10/20SMA’s and Tenkan-sen stay intact. However, contracting daily 20d Bollingers suggest prolonged consolidation, with break of pivotal levels at lay at 133.40 and 134.80, required to signal fresh direction.
Res: 133.97; 134.21; 134.58; 134.84
Sup: 133.55; 133.42; 133.00; 132.63 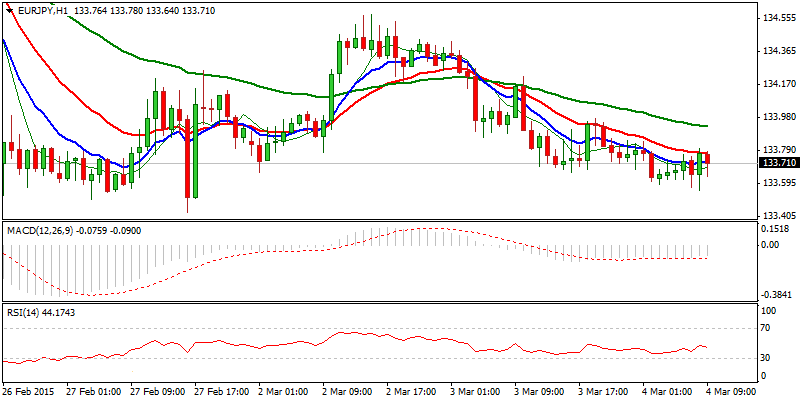
GBP/USD
Cable remains under pressure and continues to move lower, following break below daily 20SMA. Immediate focus turns towards pivotal support zone at 1.5220, higher base and Fibonacci 38.2% of 1.4950/1.5551 rally. Near-term technicals are negative, with daily indicators heading south and attacking the midlines, scope is seen for eventual break below 1.5320 handle to confirm reversal. Sideways-moving daily Kijun-sen line at 1.5269, is expected to come in focus on a break below 1.5320, with extended weakness, expected to target psychological 1.52 support, also daily Ichimoku cloud base. Descending daily cloud top and hourly lower platform at 1.5390 zone, offers immediate resistance, ahead of daily Tenkan-sen line at 1.5440, where corrective rallies should be ideally capped.
Res: 1.5400; 1.5420; 1.5440; 1.5457
Sup: 1.5320; 1.5300; 1.5269; 1.5200 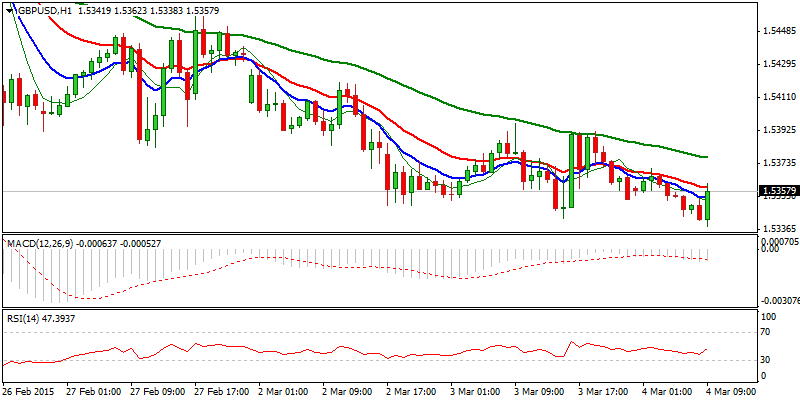
USD/JPY
The pair bounced after pullback from 120.25 high found footstep and 119.40 support zone, reinforced by ascending daily 10SMA. Near-term tone improves, with regain of 119.90 lower top, required to confirm higher low formation and turn near-term focus towards 120.25/46 targets. However, contracting 20d Bollinger bands suggest extended consolidation, before fresh action. Overall picture remains bullish and keeps the upside favored for now. Only sustained break below 119.40/30 support zone, former lower platform and daily 10SMA / Tenkan-sen, could weaken the structure and signal further easing.
Res: 119.90; 120.25; 120.46; 120.80
Sup: 119.61; 119.40; 119.27; 119.00 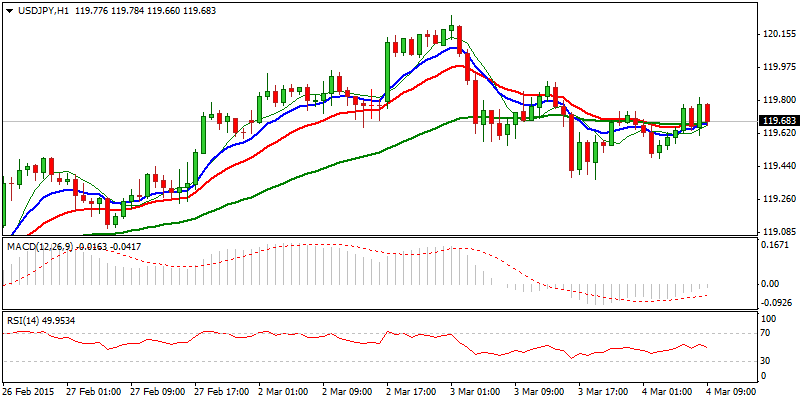
AUD/USD
The pair consolidates under fresh recovery high at 0.7842, following yesterday’s rally that ended in Bullish engulfing and closed above daily 20SMA and 0.78 handle. The rally boosted near-term technicals, which are now attacking their midlines, with sustained break higher, required to confirm reversal and re-focus pivotal 0.7911, 26 Feb high and short-term consolidation range top. Fresh strength also cracked sideways-moving daily Tenkan-sen and Kijun-sen lines at 0.7824, with close above here to give another positive signal. However, narrowed daily 20d Bollinger Bands, see risk of prolonged range trading.
Res: 0.7842; 0.7874; 0.7911; 0.7950
Sup: 0.7800; 0.7750; 0.7738; 0.7700 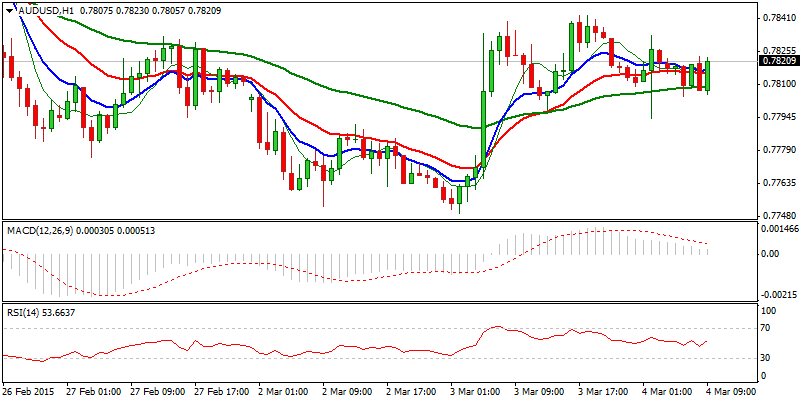
AUD/NZD
The pair trades in near-term consolidative range, with near-term studies being negatively aligned, following stall of yesterday’s recovery rally under pivotal 1.04 barrier. Yesterday’s repeated Doji with long upper shadow, signals strong selling interest and keeps the downside in near-term focus. Overall structure remains bearish, with descending daily 20SMA, maintain the pressure for eventual attack at pivotal 1.0296 support, low of 19 Feb, with break here to confirm an end of consolidative phase and commence fresh leg lower. Only break and close above daily 20SMA, currently at 1.0407, would sideline immediate downside risk and shift near-term focus towards consolidation top and pivotal barrier at 1.0472, 25 Feb high.
Res: 1.0386; 1.0407; 1.0426; 1.0472
Sup: 1.0335; 1.0320; 1.0296; 1.0285 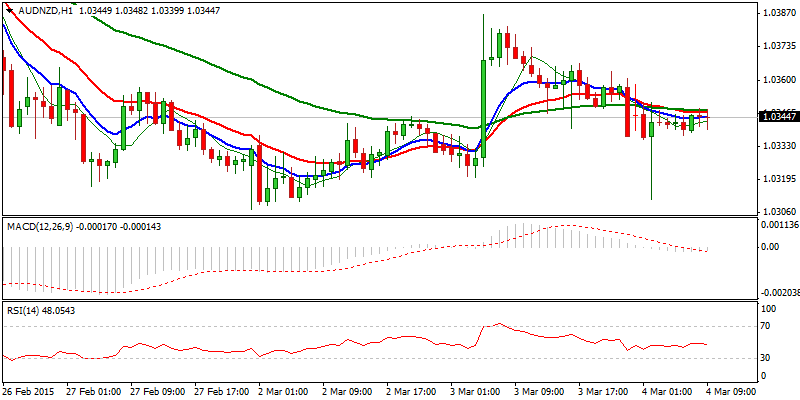
XAU/USD
Spot Gold remains at the back foot in the near-term, following yesterday’s choppy trading and recovery rejection at 1223, where descending daily 20SMA capped the rally and subsequent dip to 1195. Daily close above 1200 handle and in long-legged Doji, averted immediate downside risk, however, weak near-term technical and bearish overall picture, keep downside in focus. Sustained break below 1200 handle to focus 1190, 23/24 Feb fresh lows, with extended weakness towards 1170 higher base, not ruled out. Daily Tenkan-sen line at 1206, so far caps consolidative action, with more significant 1217, daily 20SMA, which is expected to keep the upside protected for now. Only sustained break here would give fresh bullish signals and re-focus pivotal barrier at 1224, daily cloud base.
Res: 1208; 1212; 1217; 1220
Sup: 1201; 1195; 1190; 1186 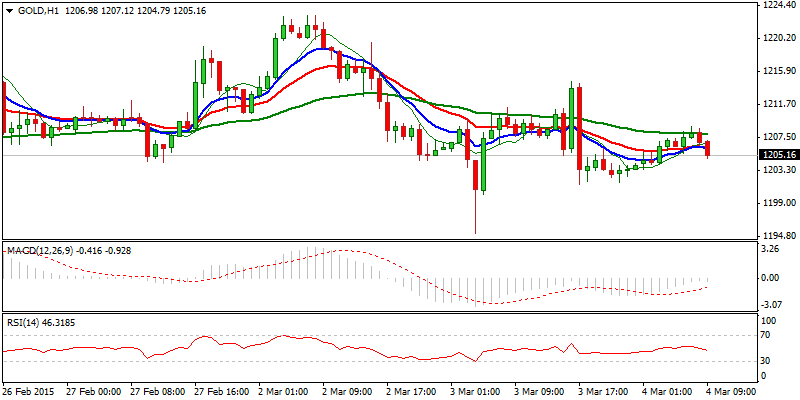
- English (UK)
- English (India)
- English (Canada)
- English (Australia)
- English (South Africa)
- English (Philippines)
- English (Nigeria)
- Deutsch
- Español (España)
- Español (México)
- Français
- Italiano
- Nederlands
- Português (Portugal)
- Polski
- Português (Brasil)
- Русский
- Türkçe
- العربية
- Ελληνικά
- Svenska
- Suomi
- עברית
- 日本語
- 한국어
- 简体中文
- 繁體中文
- Bahasa Indonesia
- Bahasa Melayu
- ไทย
- Tiếng Việt
- हिंदी
Daily Market Outlook: EUR/USD, EUR/JPY, GBP/USD, USD/JPY
Published 03/04/2015, 04:05 AM
Updated 02/21/2017, 08:25 AM
Daily Market Outlook: EUR/USD, EUR/JPY, GBP/USD, USD/JPY

FinFX
3rd party Ad. Not an offer or recommendation by Investing.com. See disclosure here or
remove ads
.
Latest comments
Install Our App
Risk Disclosure: Trading in financial instruments and/or cryptocurrencies involves high risks including the risk of losing some, or all, of your investment amount, and may not be suitable for all investors. Prices of cryptocurrencies are extremely volatile and may be affected by external factors such as financial, regulatory or political events. Trading on margin increases the financial risks.
Before deciding to trade in financial instrument or cryptocurrencies you should be fully informed of the risks and costs associated with trading the financial markets, carefully consider your investment objectives, level of experience, and risk appetite, and seek professional advice where needed.
Fusion Media would like to remind you that the data contained in this website is not necessarily real-time nor accurate. The data and prices on the website are not necessarily provided by any market or exchange, but may be provided by market makers, and so prices may not be accurate and may differ from the actual price at any given market, meaning prices are indicative and not appropriate for trading purposes. Fusion Media and any provider of the data contained in this website will not accept liability for any loss or damage as a result of your trading, or your reliance on the information contained within this website.
It is prohibited to use, store, reproduce, display, modify, transmit or distribute the data contained in this website without the explicit prior written permission of Fusion Media and/or the data provider. All intellectual property rights are reserved by the providers and/or the exchange providing the data contained in this website.
Fusion Media may be compensated by the advertisers that appear on the website, based on your interaction with the advertisements or advertisers.
© 2007-2024 - Fusion Media Limited. All Rights Reserved.