
The dollar had a miserable week last week. It fell against all its G10 counterparts and most EM currencies as well. The GBP was the biggest winner, gaining after the Bank of England revamped its forward guidance. It’s notable that a new Fed Chair explaining her approach didn’t have the same effect on the dollar even though she proved less dovish than expected. US 10-year bond yields are now some 7 bps higher than they were at the close on Monday, before Ms. Yellen’s presentation last Tuesday, and the implied rates on Fed Funds futures are 6 to 8 bps higher, yet the dollar is lower across the board. That may be because although rates have come back from their lows, they are still fairly low – the 2016 Fed Funds futures for example are still between 24 and 34 bps below their 9 January peak. The EUR/USD then was around 1.3600, vs this morning’s level of 1.3711; the USD/JPY at 104.90 (vs 101.61) and the GBP/USD at 1.6465 (vs 1.6790). We can’t expect a sustained USD rally until US rate expectations start to rise again, and we can’t expect that to happen until the data start to improve – perhaps after the winter storms end?

Taking into account the loss of some interest rate support, the weakness in USD is no surprise; what is notable, if anything, is the weakness in EUR, which has underperformed JPY and GBP during this time. That’s probably because of the divergence in monetary policy. The debate in Europe is not at all when the ECB can start normalizing rates; rather, it’s whether the ECB will have to loosen further. In that respect, the stability of EUR/USD and the narrow trading range is notable. One month historical volatility in EUR/USD has fallen to 6.5%, compared with an average of 9.7% since the beginning of 2010. It was only lower at the end of December, when the one-month tenor included the Christmas period. Investors looking for rising volatility should look at AUD/NZD and EUR/NOK; out of 15 G10 currency pairs that we track, those are the only two with higher-than-average volatility. That doesn’t necessarily mean they have the highest volatility, though; that honor goes to AUD/USD, NZD/USD, and EUR/JPY.

What’s even more worth noting is the recovery of most of the EM currencies. Several EM currencies were up 1% or more last week (ZAR over 2%, IDR nearly 4%). This is probably due to three factors: weaker US data, which has prompted a change in expectations about USD strength; the moderate stance that Fed Chair Yellen took during her testimony before Congress, which has calmed any fears about an early tightening of rates; and stronger economic data from China, particularly its unexpectedly good export performance. However, I doubt if these factors can sustain a rally for long. In particular, while the beginning of the Fed’s tapering was the catalyst for the EM currencies’ decline, the underlying reason is the domestic weakness and imbalances of many of the EM countries. This will not be solved by what happens in the US or even China. That may be why RUB suffered the biggest declines over the week: the government’s lack of interest in reform makes it a natural short.
During the Asian morning, Japan announced a disappointing preliminary GDP for Q4. GDP rose +0.3% qoq, the same as in Q3 but less than half the consensus forecast of +0.7% qoq. Tokyo stocks were up nonetheless and USD/JPY was a bit lower. The calm response to the data – showing activity far below estimates ahead of the hike in the consumption tax in April – may be because business investment and consumer spending were relatively healthy in the report, but net imports dragged down the overall result. Elsewhere, the UK Rightmove house price index showed a 3.3% mom increase in February, up from 1.0% in January. That’s likely to support GBP today.
We have only one release and one speaker during the European day; Italy’s current account balance is due out with no forecast available. ECB’s governing council member Ewald Nowotny delivers a lecture in London.
The rest of the week is much busier. The highlights are a Bank of Japan policy board meeting on Tuesday and PMI day on Thursday.
The Market
 EUR/USD Hourly Chart" title="EUR/USD Hourly Chart" width="474" height="242">
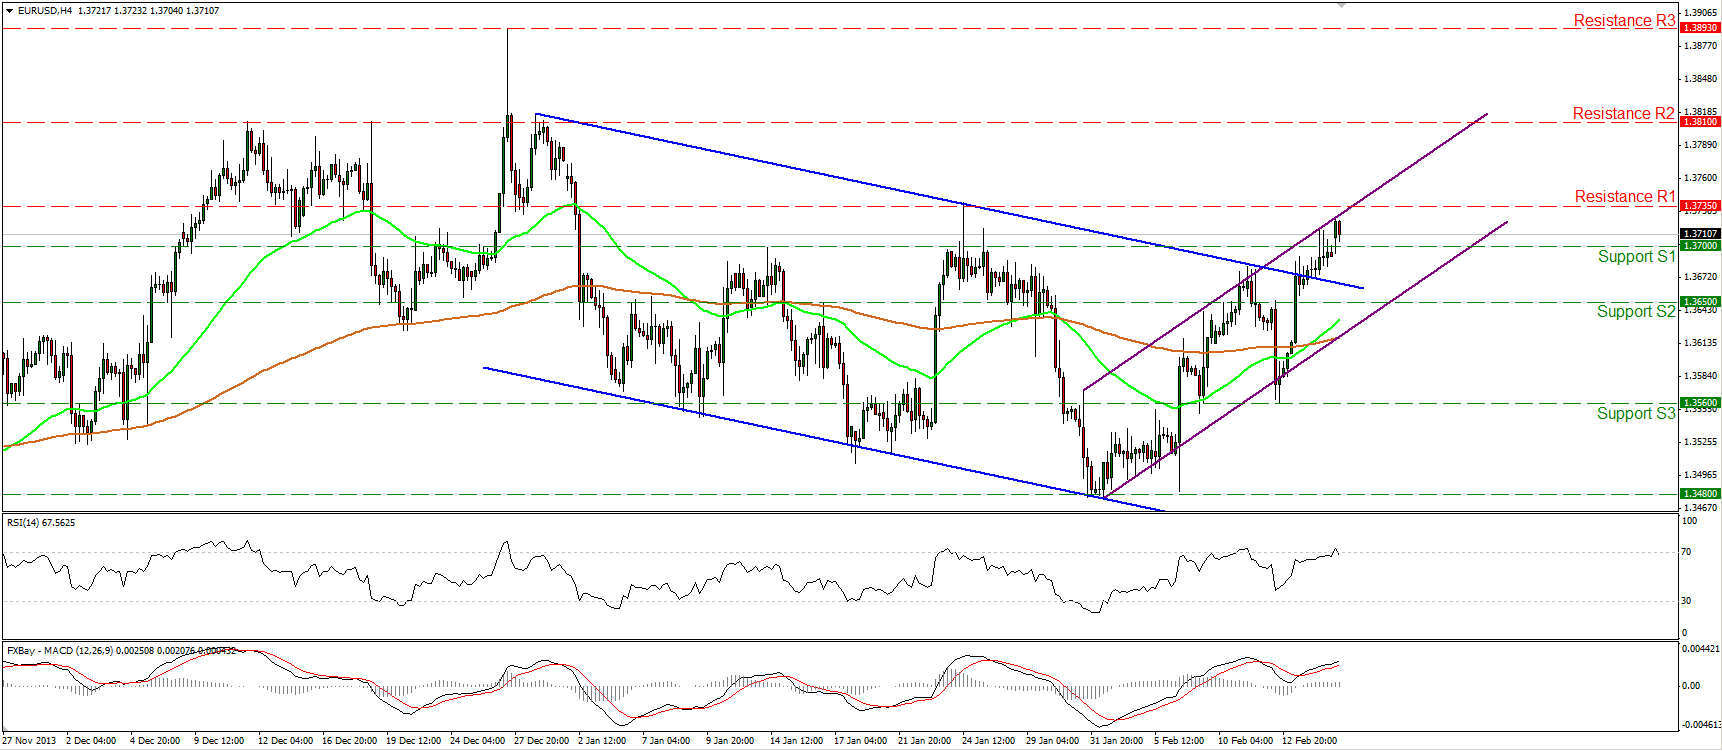
The EUR/USD managed to overcome the 1.3700 hurdle and during the early European morning is finding resistance at the upper boundary of the purple upward sloping channel, below the 1.3735 (R1) resistance. A clear upward violation of that barrier may open the way towards the next hurdle at 1.3810 (R2). However, the RSI exited its overbought territory, indicating a loss of momentum, thus some consolidation or maybe a pullback is possible before the bulls take control again. On the downside, a dip below the lower boundary of the upward purple channel and the support at 1.3650 (S2) will give a neutral outlook, while a penetration below the previous low at 1.3560 (S3) may turn the short-term picture negative again.
• Support: 1.3700 (S1), 1.3650(S2), 1.3560 (S3).
• Resistance: 1.3735 (R1), 1.3810 (R2), 1.3893 (R3).
 USD/JPY Hourly Chart" title="USD/JPY Hourly Chart" width="474" height="242">
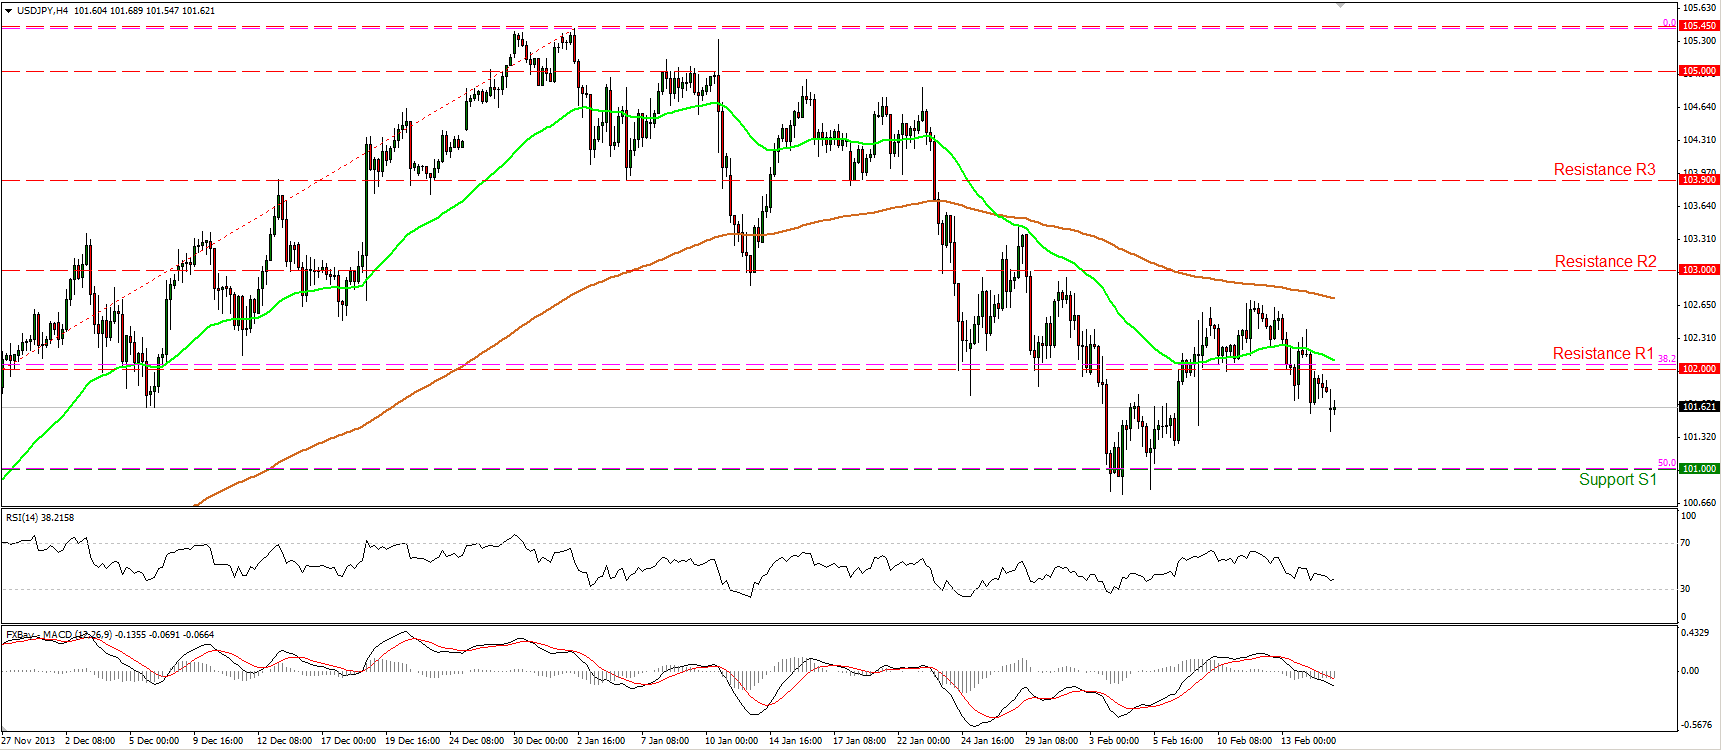
The USD/JPY fell below the 102.00 barrier on Friday. I would expect the bears to continue pushing the price lower and challenge once again the support level at 101.00 (S1), which coincides with the 50% retracement level of the 8th Oct. - 2nd Jan. advance. The MACD oscillator lies below both its zero and trigger lines, confirming the recent negative momentum of the price action. Only an upward break above the 103.00 (R1) may argue that the short-term downtrend has bottomed.
• Support: 101.00 (S1), 100.00 (S2), 99.00 (S3)
• Resistance: 102.00 (R1), 103.00 (R2), 103.90 (R3).
 EUR/GBP Hourly Chart" title="EUR/GBP Hourly Chart" width="474" height="242">
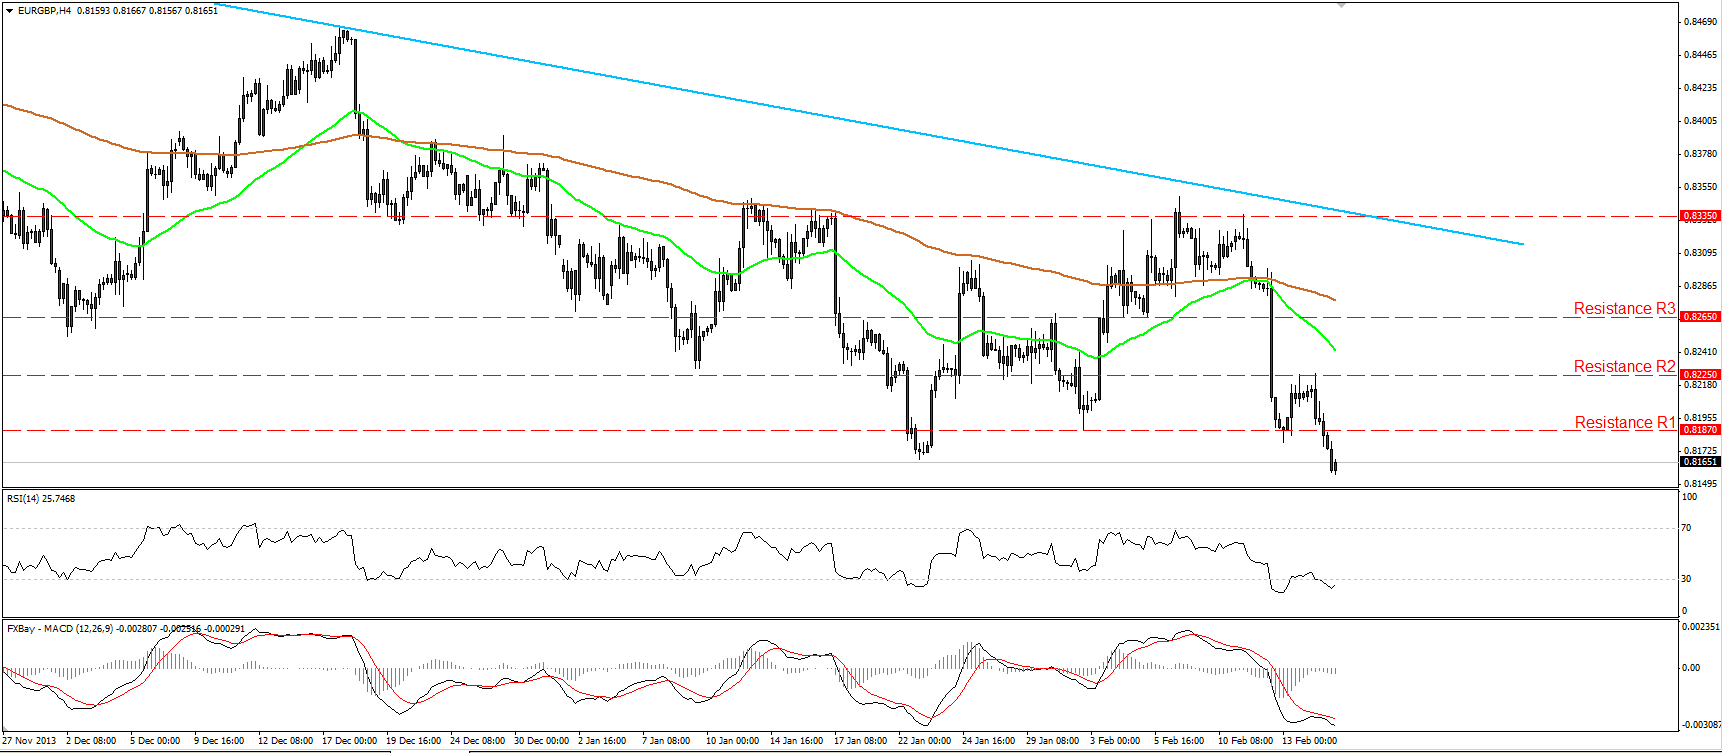
The EUR/GBP managed to fall below the 0.8187 barrier on Friday. I would expect the decline to continue and target the next support at 0.8080 (S1). The RSI is back within its oversold zone, thus another upward corrective wave upon the oscillator’s exit from the extreme territory is likely. The outlook of the pair remains negative since the rate is trading below both the moving averages. On the daily chart, the longer-term downtrend, marked by the light blue trend line, is still intact.
• Support: 0.8080 (S1), 0.8035 (S2), 0.8000 (S3).
• Resistance: 0.8187 (R1), 0.8225 (R2), 0.8265 (R3).
Gold

Gold continued climbing, reaching and breaking above the 1315 obstacle. If the bulls maintain their strong momentum I would expect them to challenge the resistance level at 1340 (R1), where an upward violation may open the way for the next one at 1360 (R2). The RSI remains within its overbought zone and thus some consolidation or a pullback during the development of further advance, cannot be ruled out. Since the precious metal is printing higher highs and higher lows, the overall short-term path remains to the upside. The only grey spot in gold’s picture is that on the daily chart, the precious metal is testing the 200-day moving average.
• Support: 1315 (S1), 1290 (S2), 1270 (S3).
• Resistance: 1340 (R1), 1360 (R2), 1376 (R3).
Oil

WTI moved higher and is currently testing again the 100.55 (R1) resistance barrier. An upward violation of that barrier followed by a clear break of the 101.35 (R2) resistance may signal the completion of a double bottom on the daily chart and have larger bullish implications. On the downside, only a clear close below the blue uptrend line and the 98.80 (S1) support would be a reason to reconsider our analysis.
• Support: 98.80 (S1), 96.50 (S2), 95.00 (S3).
• Resistance: 100.55 (R1), 101.35 (R2), 102.00 (R3).
BENCHMARK CURRENCY RATES - DAILY GAINERS AND LOSERS

MARKETS SUMMARY
Disclaimer: This information is not considered as investment advice or investment recommendation but instead a marketing communication. This material has not been prepared in accordance with legal requirements designed to promote the independence of investment research, and that it is not subject to any prohibition on dealing ahead of the dissemination of investment research. IronFX may act as principal (i.e. the counterparty) when executing clients’ orders. This material is just the personal opinion of the author(s) and client’s investment objective and risks tolerance have not been considered. IronFX is not responsible for any loss arising from any information herein contained. Past performance does not guarantee or predict any future performance.
Redistribution of this material is strictly prohibited. Risk Warning: Forex and CFDs are leveraged products and involves a high level of risk. It is possible to lose all your capital. These products may not be suitable for everyone and you should ensure that you understand the risks involved. Seek independent advice if necessary. IronFx Financial Services Limited is authorised and regulated by CySEC (Licence no. 125/10). IronFX UK Limited is authorised and regulated by FCA (Registration no. 585561). IronFX (Australia) Pty Ltd is authorized and regulated by ASIC (AFSL no. 417482)