
The day starts with trade data and retail sales from Sweden for November. No forecast is available for the country’s trade balance, while retail sales are estimated to be up 0.4% mom from 0.0% mom in October. From Italy, business confidence for December is expected to rise to 99.0 from 98.1.
Later in the day, US pending home sales are estimated to have risen 1.0% mom in November, a turnaround from -0.6% mom in October. This will bring the yoy rate up to -0.2% from -2.2%. Finally, Dallas Fed Manufacturing Activity for December is expected to rise to 2.0 from 1.9.
As for the rest of the week, on Tuesday we have the S&P/Case-Shiller house price index for October, the Chicago purchasing manager’s index and the Conference Board consumer confidence, both for December. During the Asian morning Wednesday, China releases its manufacturing PMI for December. More manufacturing PMIs are coming out on Thursday. We have the final data for December from France, Germany and Eurozone as a whole. We also have December manufacturing PMIs from Italy, Sweden, the UK and the US. Finally on Friday, China releases its non-manufacturing PMI and Italy its preliminary CPI for December. From UK we get the nationwide house price index for December, construction PMI for the same month and mortgage approvals for November. Eurozone’s M3 annual growth for November is also coming out.
EUR/USD
 EUR/USD Hourly Chart" title="EUR/USD Hourly Chart" width="1723" height="753">
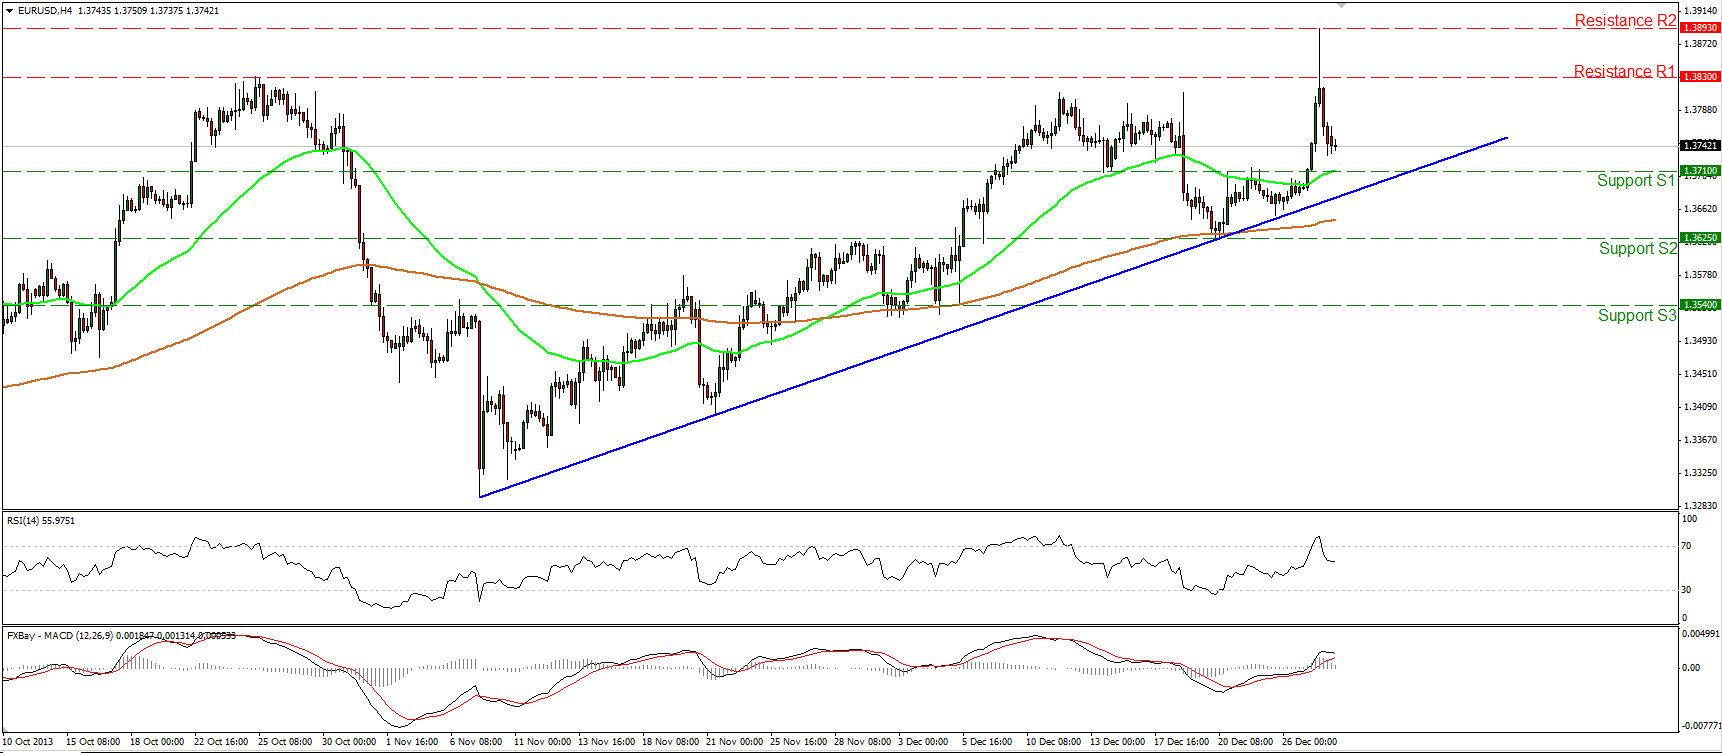
The EUR/USD surged on Friday but after hitting 1.3893 (R2) it gave back a big portion of its daily gains. At the time of writing, the pair is trading above the 1.3710 (S1) barrier, and a rebound near that level may challenge once again the resistance area near 1.3830 (R1). The rate is trading above both the moving averages and above the blue trend line, thus the upside path remains in effect at the moment. A break below 1.3625 (S2) is needed to turn the picture negative.
• Support: 1.3710 (S1), 1.3625 (S2), 1.3540 (S3).
• Resistance: 1.3830 (R1), 1.3893 (R2), 1.4170 (R3).
 USD/JPY Hourly Chart" title="USD/JPY Hourly Chart" width="1723" height="753">
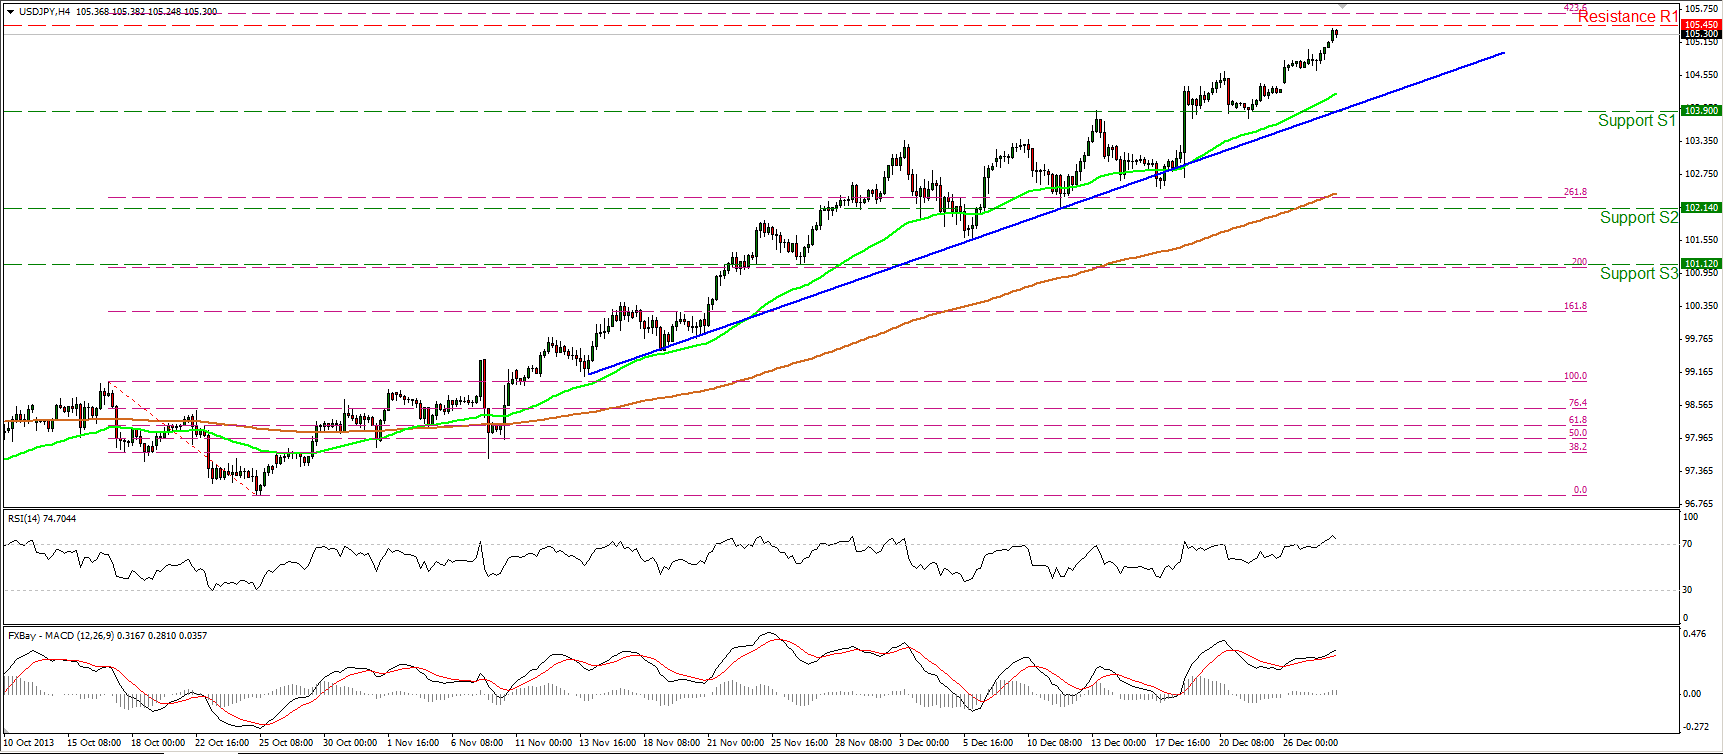
The USD/JPY continued its advance and is now slightly below the resistance area between the barrier of 105.45 (R1) and the 423.6% Fibonacci extension level of the 17th -25th Oct. bearish wave. The short-term trend remains in effect, since the price is well supported by the blue support line and the 50-period moving average. However the RSI lies in its overbought zone, pointing downwards, thus I would expect a price pullback before the bulls prevail again.
• Support: 103.90 (S1), 102.14 (S2), 101.12 (S3).
• Resistance: 105.45 (R1), 108.25 (R2), 110.60 (R3).
 EUR/GBP" title="EUR/GBP" width="1723" height="753">
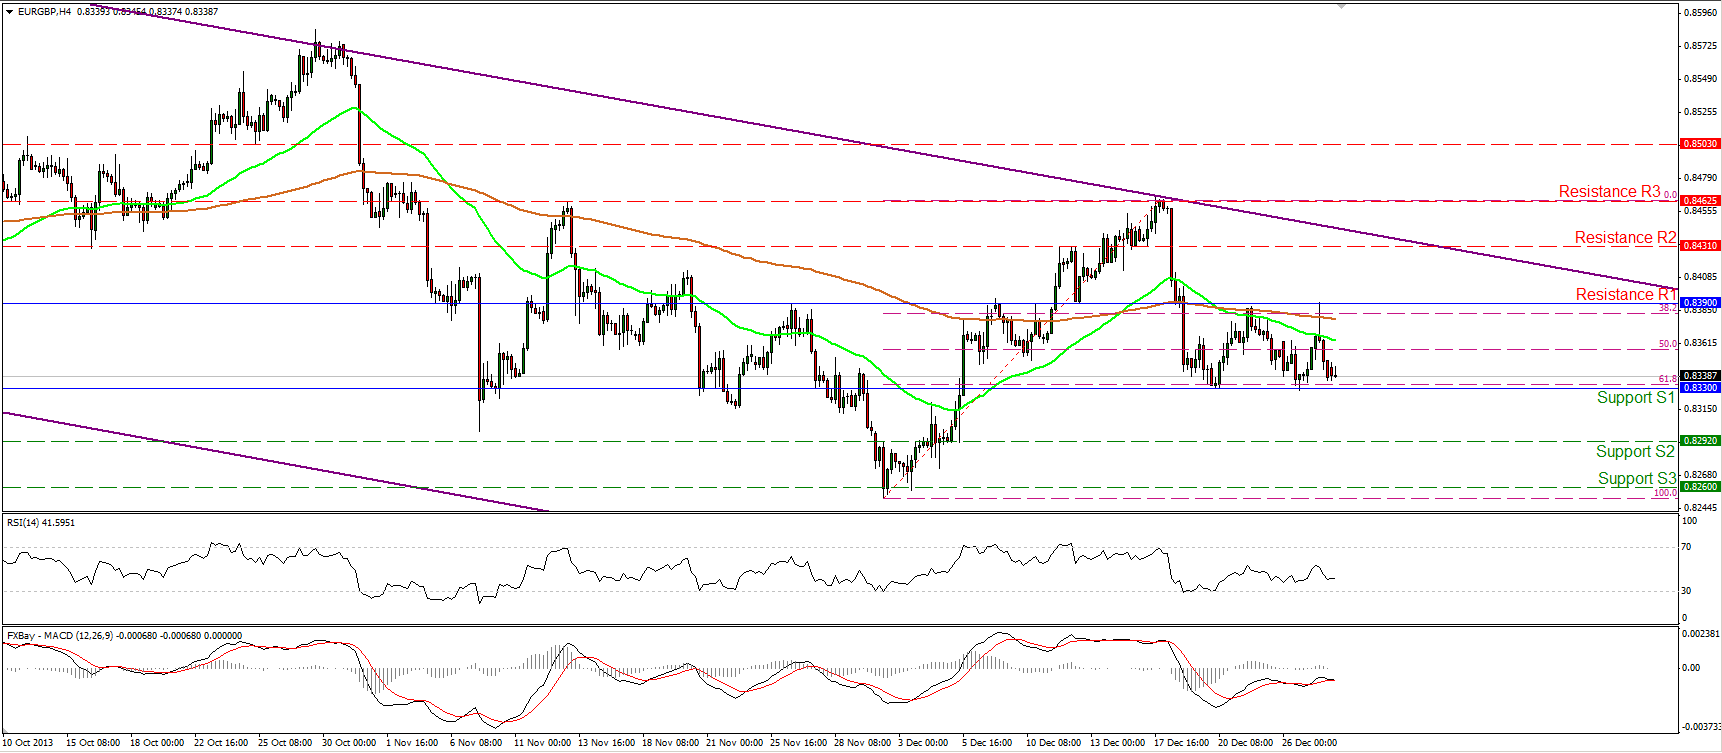
The EUR/GBP found resistance for a second time at the 0.8390 (R1) barrier and moved lower. Currently the pair is heading for a third test at the 61.8% Fibonacci retracement level of the previous short term advance at 0.8330 (S1). A clear dip below that obstacle may challenge the next support level at 0.8292 (S2). On the daily chart, the rate remains within a downward sloping channel (purple lines).
• Support: 0.8330 (S1), 0.8292 (S2), 0.8260 (S3).
• Resistance: 0.8390 (R1), 0.8431(R2), 0.8462 (R3).
 XAU/USD Hourly Chart" title="XAU/USD Hourly Chart" width="1723" height="753">
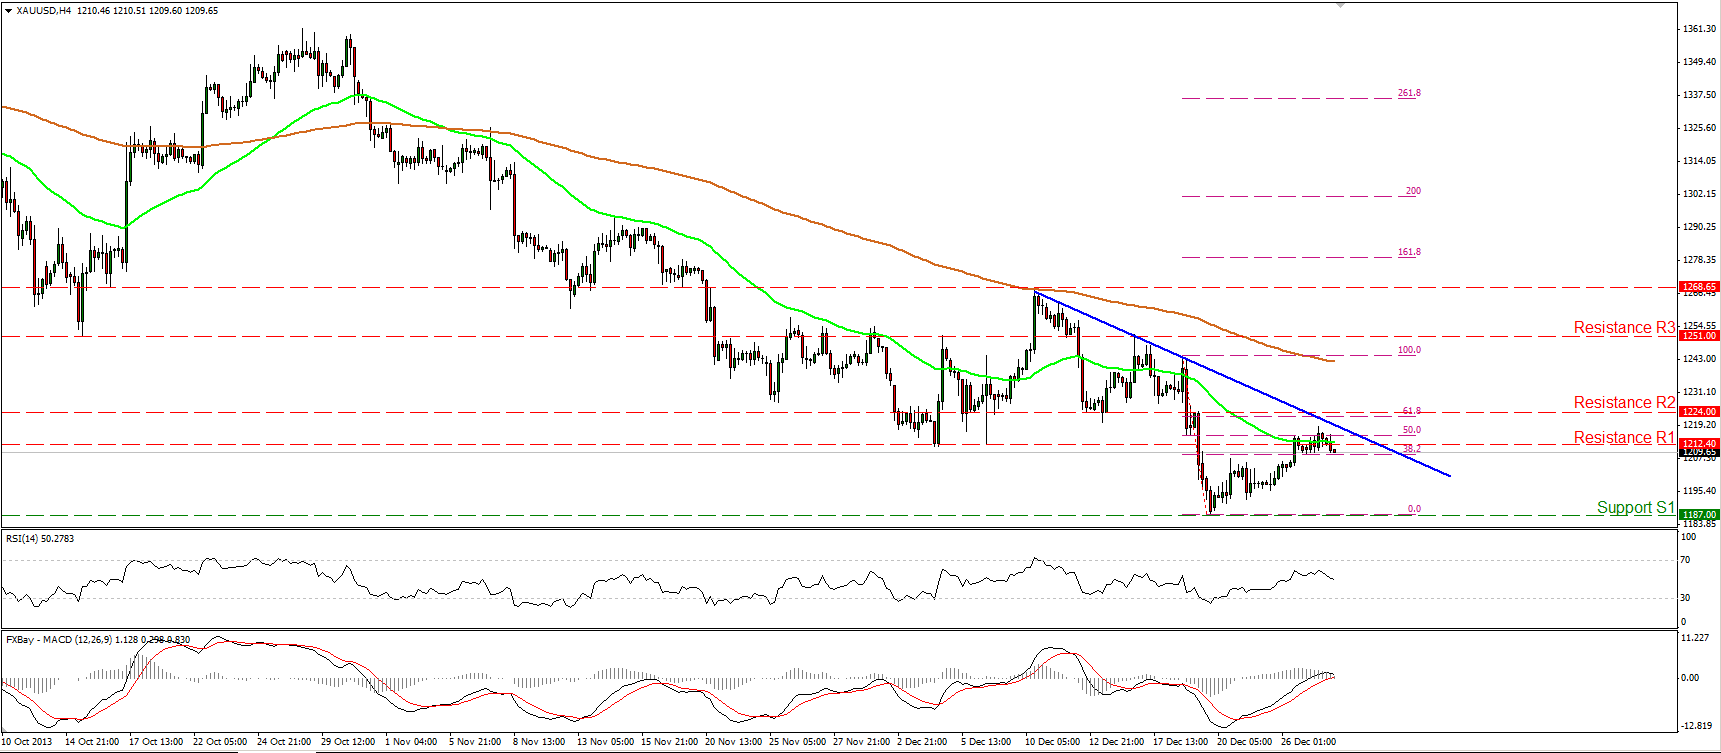
Gold moved in a consolidative mode, remaining near the 50% retracement level of the prior bearish wave. The RSI is pointing downwards, while the MACD seems ready to cross below its trigger line. Since the precious metal is trading below the blue downtrend line and the 50-period moving average remains below the 200-period moving average, I consider the recent advance as an upward corrective wave. Only a violation of the trend line and the resistance at 1224 (R2) would be a reason to reconsider our analysis.
• Support: 1187 (S1), 1180 (S2), 1155 (S3).
• Resistance: 1212 (R1), 1224 (R2), 1251 (R3).
Oil

WTI managed to overcome the key barrier of 100.00. If the bulls are strong enough to drive the battle higher and violate the 101.10 (R1) resistance level, we may experience extensions towards the next resistance at 103.15 (R2). The price remains within the upward sloping channel, while the 50 period moving average lies above the 200-period moving average, confirming the bullish picture of WTI.
• Support: 100.00 (S1), 98.90 (S2), 97.25 (S3).
• Resistance: 101.10 (R1), 103.15 (R2), 104.45 (R3).
BENCHMARK CURRENCY RATES - DAILY GAINERS AND LOSERS

MARKETS SUMMARY
