
It’s working already!
I had expected that the dollar’s weakness in late December was due largely to end-year position-closing and was not a reflection on the currency’s likely direction in 2014. We’re only a few hours into the year but so far it seems that I was right: the dollar is up against most of its G10 counterparts this morning as well as the EM currencies. The only major exception is GBP, which has gained across the board this morning. I would expect to see more USD buying as the day goes on.
The only major economic indicator out yesterday was China’s manufacturing PMI for December, which was a bit worse than expected, falling to 51.0 from 51.4 (expected: 51.2). Much of the rest of the world will announce its manufacturing PMIs for December today. Sweden’s manufacturing PMI for December is expected to fall to 55.2 from 56.0. That could prompt some profit-taking on the SEK, which has had a pretty good run recently (2nd best performing G10 currency in December) while Italy’s figure is estimated to rise modestly to 51.7 from 51.4. We also have the final manufacturing PMIs from France, Germany and Eurozone as a whole. The UK number for the month is forecast to have remained unchanged at 58.4, which could continue to support GBP. From the US, the ISM manufacturing PMI is also expected to fall to 56.9 from 57.3 in November, while the weekly jobless claims are forecast to rise to 342k from 338k. The news could put a dent in the dollar’s strong start, although as the FX market seemed to have decoupled from fundamentals in the last week or two of the year, we could have a similar period immediately following the beginning of the New Year.
No speakers during the day. A couple of Fed officials will give the first speeches of the year on Friday.
What worked in 2013 and what’s forecast to work in 2014? Last year, the Danish Krone (DKK) was the best-performing currency vs the dollar on a spot basis (+4.18%, ignoring interest paid), followed closely by the EUR (+4.17). After that came CHF (+2.52%), GBP (+1.86%) and SEK (+1.01%). NZD (-0.89%), CAD (-6.61%), NOK (-8.34%) and AUD (-14.21%) all weakened vs USD, with JPY (-17.62%) being the worst performing G10 currency. But for some of these, the interest return made up for part of the losses. EUR for example at least still has positive interest rates, while DKK has negative rates. Taking that into account, the total return on holding a long EUR/USD position rose to +4.31% while short USD/DKK fell to 4.16%, meaning EUR pushes out DKK for the best-performing spot. After that are CHF, GBP, and SEK, the same order as without interest. NZD’s negative spot return turned into a positive total return of +1.95% after taking into account the currency’s 2.87% interest rate in 2013. After that, the losers were the same order: CAD, NOK, AUD and JPY.
For this year, using Bloomberg’s consensus forecasts, the market expects the AUD to be the winner: the smallest expected spot decline vs US (-1.3%), which, after interest, is expected to turn into a +1.35% total return. NZD is expected to show a 2.61% spot decline but a +0.31% positive total return. All of the other G10 currencies are forecast to show both negative spot and total returns, with CHF being the bottom (-8.92% forecast total return). JPY is expected to be in the middle, with a -3.39% spot loss and -3.28% total loss. This seems unlikely to me as JPY is usually at the extremes: for the last 11 years it hasn’t been in the middle. 
The Market
EUR/USD 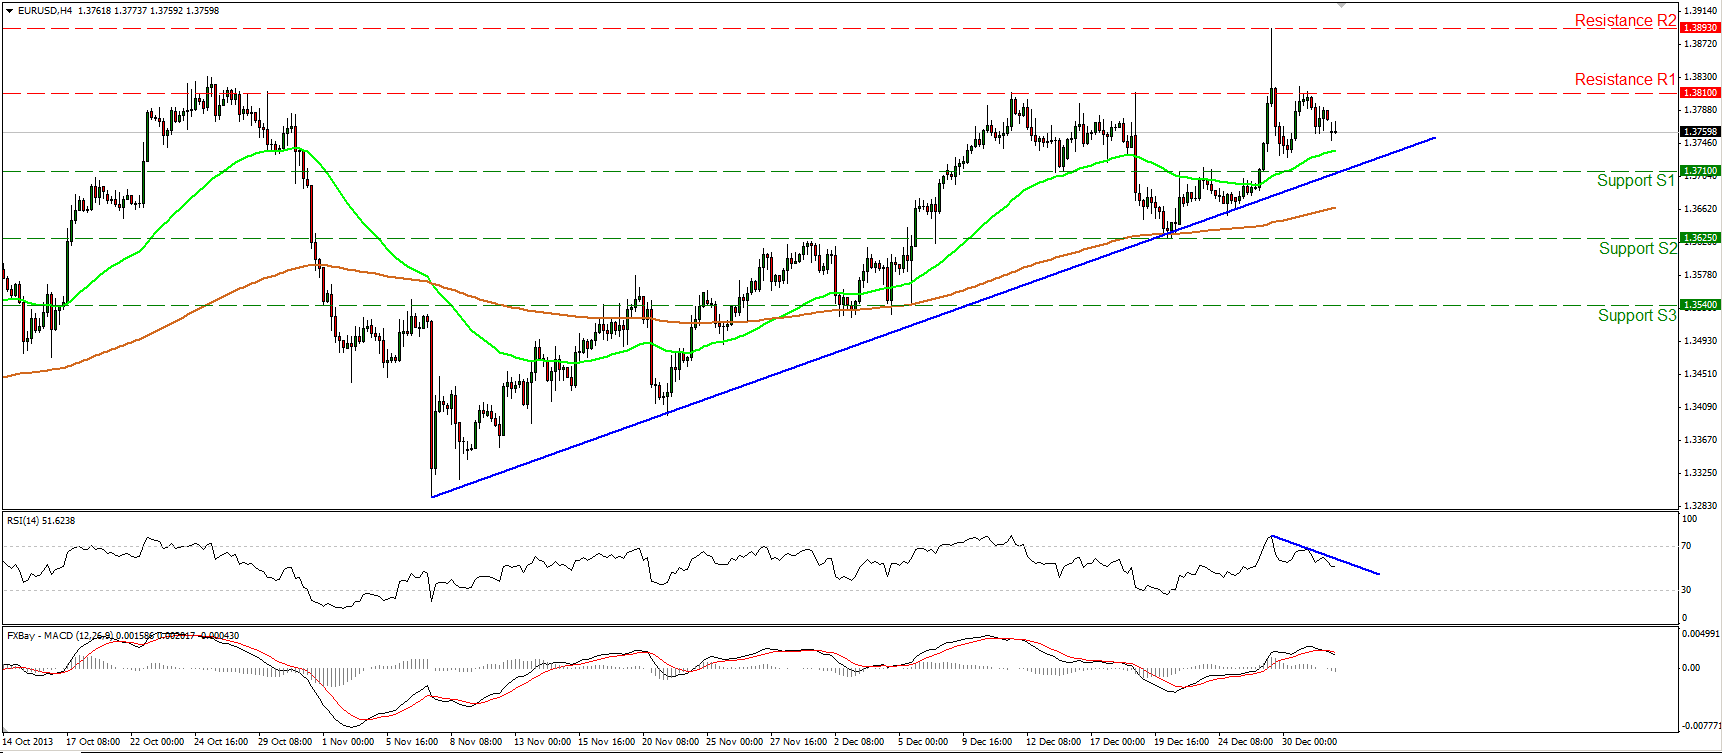 EUR/USD Hourly Chart" title="EUR/USD Hourly Chart" width="385" height="244" />
The EUR/USD moved lower after finding resistance at the 1.3810 (R1) barrier. Both our momentum studies confirm the downward movement since the RSI’s slope is to the downside, while the MADC, although in positive territory, crossed below its trigger line. Nonetheless, the uptrend is still in progress and as long as the low of 1.3625 (S2) is intact, I consider the short-term bias to be to the upside and the current downward wave as a pullback.
• Support: 1.3710 (S1), 1.3625 (S2), 1.3540 (S3).
• Resistance: 1.3810 (R1), 1.3893 (R2), 1.4170 (R3).
USD/JPY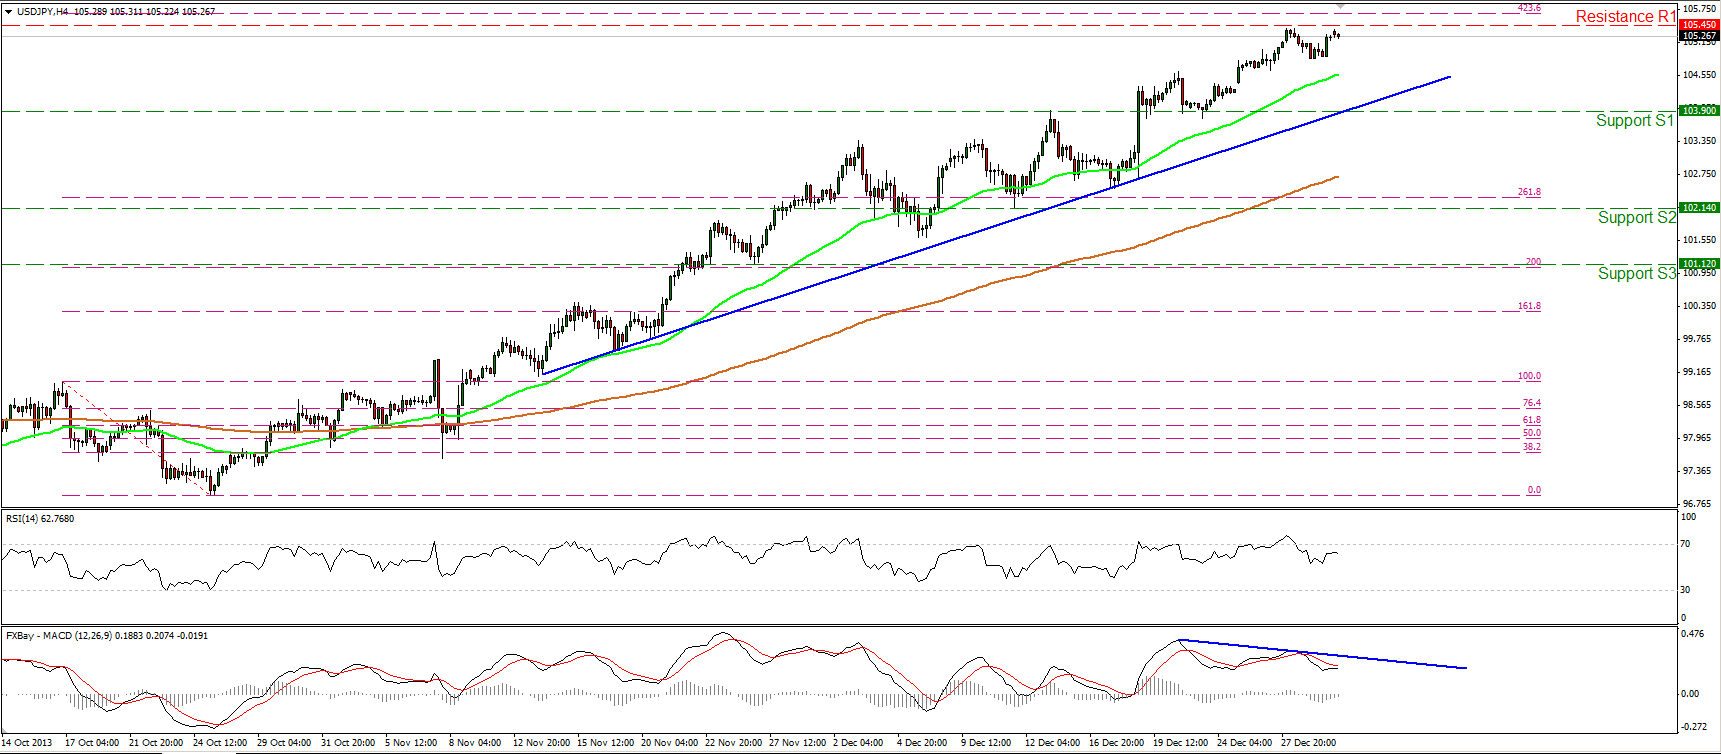 USD/JPY Hourly Chart" title="USD/JPY Hourly Chart" width="385" height="244" />
The USD/JPY moved in a consolidative mode, remaining below the resistance area between the barrier of 105.45 (R1) and the 423.6% Fibonacci extension level of the 17th -25th Oct. bearish wave. If the longs are strong enough to overcome that strong resistance area, I would expect them to trigger extensions towards the area of 107.00 (R2). The short-term uptrend remains in effect, since the price is well supported by the blue support line and the 50-period moving average. My only concern is that negative divergence is identified between the MACD oscillator and the price action.
• Support: 103.90 (S1), 102.14 (S2), 101.12 (S3).
• Resistance: 105.45 (R1), 107.00 (R2), 109.00 (R3).
EUR/GBP 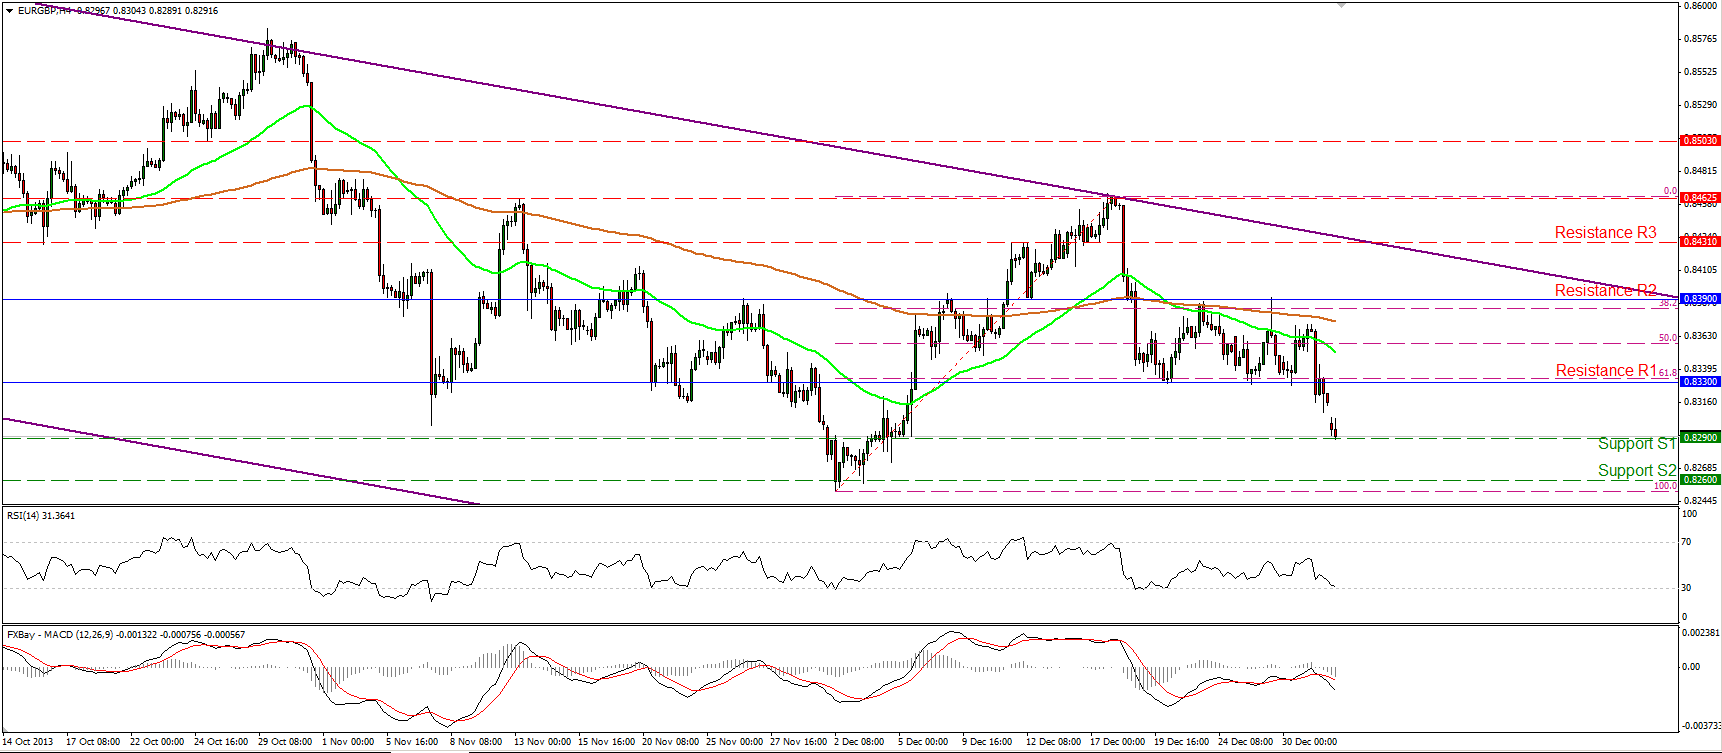 EUR/GBP Hourly Chart" title="EUR/GBP Hourly Chart" width="385" height="244" />
The EUR/GBP fell below the 61.8% Fibonacci retracement level of the previous short term advance at 0.8330 and reached the support barrier of 0.8290 (S1). In early European trading the price is testing that hurdle and a clear dip below it may target the next support at 0.8260 (S2). The MACD momentum study crossed below its trigger line in its bearish zone, increasing the possibilities for further decline. On the daily chart, the rate remains within a downward sloping channel (purple lines).
• Support: 0.8290 (S1), 0.8260 (S2), 0.8220 (S3).
• Resistance: 0.8330 (R1), 0.8390 (R2), 0.8431 (R3).
Gold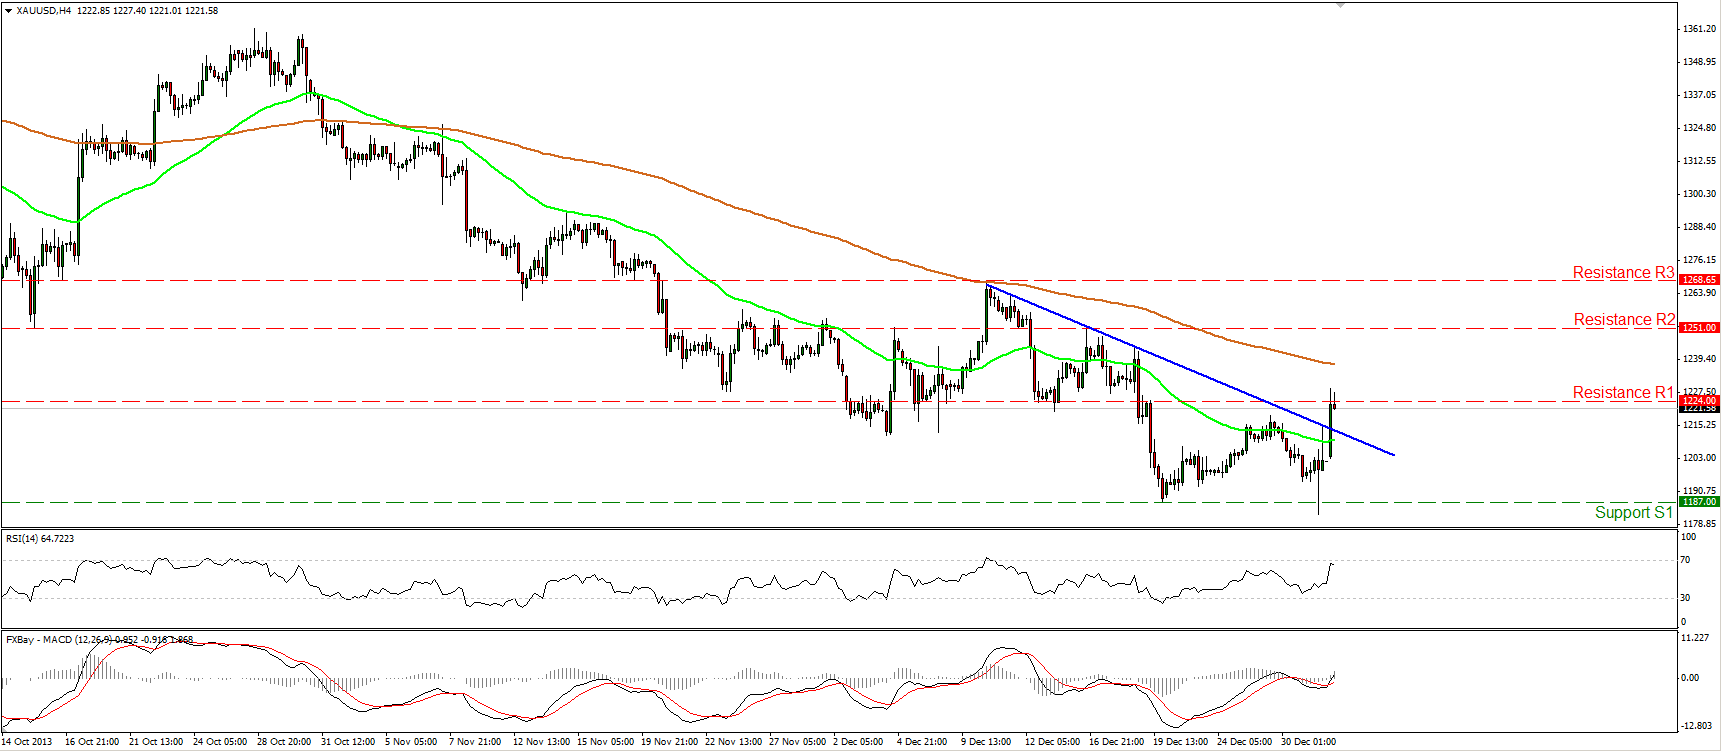 XAU/USD Hourly Chart" title="XAU/USD Hourly Chart" width="385" height="244" />
Gold surged on Tuesday, breaking above the short-term blue resistance line. During the early European morning, the precious metal is testing the resistance barrier of 1224 (R1). If the positive momentum continues and a violation of that obstacle occurs, we may see the price challenging the next resistance at 1251 (R2). Relying on our momentum studies does not seem a solid strategy. The MACD managed to cross above both its signal and zero lines, but the RSI is finding resistance near its 70 level. On the daily and weekly charts the longer-term downtrend remains in effect.
• Support: 1187 (S1), 1155 (S2), 1082 (S3).
• Resistance: 1224 (R1), 1251 (R2), 1268 (R3).
Oil
WTI broke below the 98.90 on Tuesday, but today is moving slightly upwards. If the price finds resistance at the 98.90 (R1) level and the bears manage to take control, we may experience extensions towards the support of 97.25 (S2), which coincides with the 38.2% Fibonacci retracement level of the 92.00-100.60 advance. On the other, hand a continuation of the rise above 98.90 (R1) might challenge once again the 100.60 (R2) resistance level. Our momentum studies provide mixed signals. The MACD oscillator lies below its trigger line and managed to obtain a negative sign, while the RSI rebounded near its 30 level and moved upwards. As a result I remain neutral on WTI until the picture becomes clearer.
• Support: 97.25 (S1), 95.35 (S2), 94.00 (S3).
• Resistance: 98.90 (R1), 100.60 (R2), 101.90 (R3).
BENCHMARK CURRENCY RATES - DAILY GAINERS AND LOSERS
Disclaimer: This information is not considered as investment advice or investment recommendation but instead a marketing communication. This material has not been prepared in accordance with legal requirements designed to promote the independence of investment research, and that it is not subject to any prohibition on dealing ahead of the dissemination of investment research. IronFX may act as principal (i.e. the counterparty) when executing clients’ orders. This material is just the personal opinion of the author(s) and client’s investment objective and risks tolerance have not been considered. IronFX is not responsible for any loss arising from any information herein contained. Past performance does not guarantee or predict any future performance. Redistribution of this material is strictly prohibited. Risk Warning: Forex and CFDs are leveraged products and involves a high level of risk.
It is possible to lose all your capital. These products may not be suitable for everyone and you should ensure that you understand the risks involved. Seek independent advice if necessary. IronFx Financial Services Limited is authorised and regulated by CySEC (Licence no. 125/10). IronFX UK Limited is authorised and regulated by FCA (Registration no. 585561). IronFX (Australia) Pty Ltd is authorized and regulated by ASIC (AFSL no. 417482)