The dollar was mixed Wednesday morning in Europe, gaining against some of its G10 counterparts but easing against a few, too. It was mostly higher vs EM. There was no consistent pattern. On the contrary, there were some noticeable divergences. With regards to the “safe haven” currencies, the USD gained vs the CHF, but fell vs the JPY, while vs the high-beta commodity currencies it gained vs the NZD and CAD but fell (slightly) vs the AUD. That suggests individual country stories, such as the fall in the TOPIX index overnight and yesterday’s RBA statement, were as important as the overall sentiment towards the dollar. There were no significant developments in the US budget impasse overnight. While several Republican Congressmen have criticized their more intransigent colleagues for holding out for an impossible deal, others (in particular, former Vice President candidate Rand Paul) have said that the current disagreement is just a “prequel” for the real fight over the debt ceiling in a couple of weeks. So that story probably has further to run.
The political stand-off does not seem to be disturbing US investors that much, however. Perhaps they agree with US Senator John McCain, who said, “I've seen this movie before, and I know how it comes out.” All major US stock indices closed higher on the day, with the NASDAQ and small cap equity indices both making new highs for the year. Gold on the other hand collapsed, falling even more than silver, which is notable as silver is usually more volatile than gold is (the average 1m historical volatility of silver has been double that of gold over the last three years). Gold’s inability to rally despite lower US rates and a weaker dollar demonstrates that its role as the ultimate safe-haven investment is over for now. Either that, or it shows that investors aren’t that worried about the US political standoff and there will not be a major flight to safety. Although in that case, I would expect the EM currencies to be doing better.
There are two major events on the schedule for today. First, Italian PM Letta will speak in Parliament about the outlook for the government. He is expected to call a vote of confidence, which would be a crucial moment for the Eurozone. Press reports suggest that Letta has managed to convince former PM Berlusconi’s People of Liberty (PDL) Party to back him and now has enough votes to secure a majority in both houses of parliament. The idea sent Italian stocks up 3.1% yesterday, while Italian bond yields fell 15 bps. Nonetheless it’s noticeable that the EUR/USD is lower this morning than it was this time yesterday, which implies that the FX market isn’t that concerned about Italian politics either way. In any case, even if Letta were to lose the vote, it’s hard to imagine that the situation would be worse than it was when the current mess began following the election on Feb. 24th. The EUR/USD only dropped 2 cents from the day before the election to the bottom in the following week. Since then, the nihilistic 5-Star Movement has lost some momentum and so the range of possibilities, although not wonderful, is probably better than it was then.
Also the European Central Bank (ECB) Governing Council meets. As no one expects a change in rates, the focus will be as usual on the press conference by ECB President Mario Draghi after the meeting. We expect he will repeat his guidance that interest rates would remain “at present or lower levels for an extended period of time.” One key point will be whether the phrase “or lower” appears again. By doing so, Draghi will try to support growth in Eurozone, which lately has showed some signs of improvement. He may also clarify whether the ECB is considering offering a replacement for its expiring 3-year long-term refinancing operations towards the end of the year. His dovish comments are usually negative for the EUR/USD and so that is the direction I would expect the market to take. With that, the USD/CHF may continue to recover as well.
In the UK, the construction PMI is forecast to rise in September. Halifax house price index may also be released; it too is forecast to rise. Higher house prices = higher GBP.
In the US, the ADP employment report is expected to show that the private sector gained 180k jobs in September, about the same as 176k in August. The ADP report takes on new importance because the US non-farm payroll figures will not be released on Friday if the government is still shut down. Last month the ADP report undershot estimates of 184k and came in at 176k but the dollar gained nonetheless; however the NFP also disappointed, rising only 169k vs estimates of 180k, and the dollar came back down.
The Market:
EUR/USDEUR/USD" title="EUR/USD" src="https://d1-invdn-com.akamaized.net/content/pic5668a7f55a3d48a14fbcd91b127a93c1.png" height="810" width="1731" />
The EUR/USD tested once more the 1.3564 (R1) ceiling and moved lower, remaining in its short-term consolidative range between the support level of 1.3461 (S1) and the resistance of 1.3564 (R1). The MACD oscillator remains above zero but below its trigger line, confirming the weakness of the upward pressure on EUR/USD. In my opinion, we should wait for a clear break out of the sideways range in order to determine the forthcoming direction of the price.
• Support is identified at 1.3461 (S1), 1.3400 (S2) and 1.3321 (S3) respectively.
• Resistance levels are the level of 1.3564 (R1), followed by 1.3655 (R2) and 1.3706 (R3) (daily chart).
USD/JPYUSD/JPY" title="USD/JPY" src="https://d1-invdn-com.akamaized.net/content/picdadbfb20336182d47b195168f42c5816.png" height="810" width="1731" />
The USD/JPY moved lower after finding resistance at the 98.50 (R1) barrier. In early European trading the pair is testing the 97.73 (S1) support, where a clear downward violation should signal the completion of a failure swing and the bears should target the critical 97.00 level. The bearish cross of the moving averages alongside with the downward slope of the oscillators increases the probability for such a downward movement.
• Support levels are at 97.73 (S1), followed by 97.00 (S2) and 96.38 (S3).
• Resistance is identified at 98.50 (R1), followed by 99.15 (R2) and 99.66 (R3).
EUR/GBPEUR/GBP" title="EUR/GBP" src="https://d1-invdn-com.akamaized.net/content/pic005ebdfffd284a9f3028aa139406a3f3.png" height="810" width="1731" />
The EUR/GBP moved higher yesterday and is currently testing the resistance of 0.8356 (R1). A bulls’ victory at that hurdle should target the next resistance at 0.8418 (R2), while if the bears prevail, they are likely to extend the prior downward path of the rate. I would consider any upward movement as a pullback or a short term correction, since the pair is still trading in the blue downtrend channel, with the bearish cross of the moving averages and the negative value of MACD confirming the whole bearish picture.
• Support levels are identified at 0.8319 (S1), 0.8273 (S2) and 0.8224(S3). All are found from the daily chart.
• Resistance is found at 0.8356 (R1), followed by 0.8418 (R2) and 0.8462 (R3).
GoldXAU/USD" title="XAU/USD" src="https://d1-invdn-com.akamaized.net/content/pic9767d182aeed2b8ff674eca6f54aeb1a.png" height="810" width="1731" />
Gold collapsed yesterday, penetrating two support levels in a row (today’s resistance). The fall seems to complete a bearish flag continuation pattern which, combined with our negative short term studies, favors the bearish picture of gold. The 20-period moving average lies below the 200-period moving average while the MACD oscillator lies below its trigger line in a negative territory. However, the RSI’s reading is a cause for some concern as it seems ready to exit its oversold zone, and as a result, an upside pullback is possible. It is important to note that the precious metal is near the critical floor of 1273 (S1). A clear downward break of that important levell would be likely to trigger extensions towards new short-term lows.
• Support levels are at 1273 (S1), followed by 1242 (S2) and 1208 (S3).
• Resistance is identified at the 1291 (R1) level, followed by 1316 (R2) and 1343 (R3).
Oil
WTI tested for a second consecutive day the 102.23 (R1) barrier and moved lower. During the European opening the price is trading below that level and it seems that the bears are ready to extend their moves towards the 100.72 (S1) support, where a clear break should challenge the next floor at 99.18 (S2). Moreover, WTI lies below both the 20- and 200- period moving averages and alongside with the negative value of MACD, they increase the probabilities for the continuation of the downward bias.
• Support levels are at 100.72 (S1), 99.18 (S2) and 98.00 (S3). The latter two are identified on the daily chart.
• Resistance levels are at 102.23 (R1), followed by 103.53 (R2) and 104.40 (R3).
BENCHMARK CURRENCY RATES - DAILY GAINERS AND LOSERS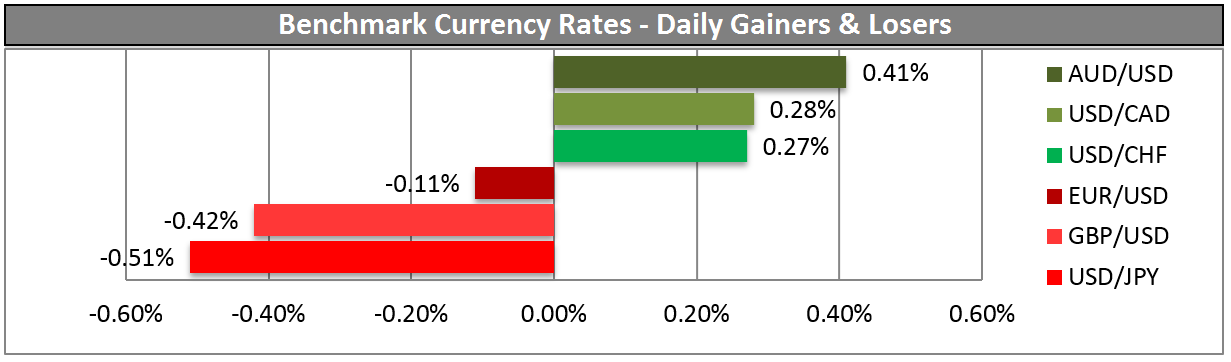
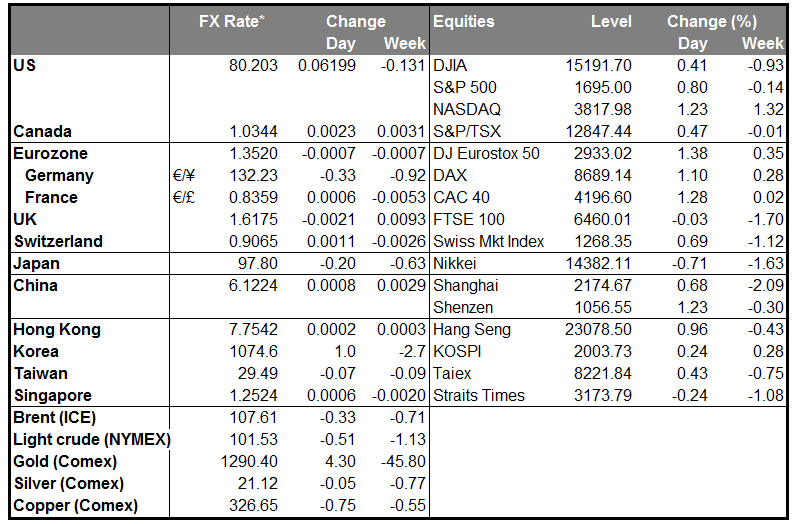
MARKETS SUMMARY: