EUR fall vs falling USD suggests rethink of ECB Yesterday’s fall in EUR/USD is quite conspicuous against the background of a generally weak dollar. The common currency was the only loser vs USD among the G10 currencies during the European day yesterday despite the absence of major economic news from Eurozone. With so many ECB officials talking about the possibility of negative interest rates and even QE, the market is starting to realize the diverging policies between the ECB and the Fed and is discounting at least further talk about loosening from the ECB at the Council meeting next week. In that context, today’s announcement of Germany’s preliminary CPI for March will be closely watched as an indication of Monday’s Eurozone CPI data. (And within the German data, Saxony’s CPI always gets considerable attention as the first of the regional CPIs to be announced.)
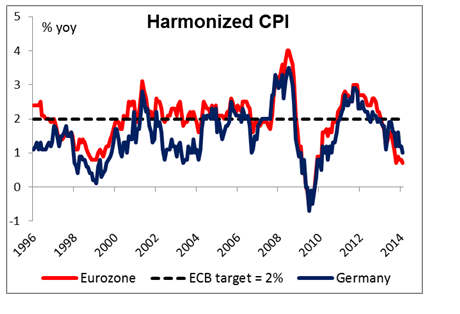
German inflation is forecast to have slowed to +0.9% yoy from +1.0% yoy in February. Considering that the Eurozone CPI for the month, to be released on Monday, is expected to have slowed to +0.6% yoy from +0.7% yoy, this could add some pressure on the ECB to ease at next week’s meeting and could be EUR-negative. Looking back to the beginning of our data in 1996, the year-on-year rate of Eurozone inflation moves in the same direction as German inflation 66% of the time. The hit ratio is a little bit higher – 73% -- for the last five years. Also, comments today from ECB Governing Council members Ignazio Visco and Jens Weidmann will be closely watched ahead of next week’s meeting. The market will particularly want to hear if Weidmann expands on his recent statements about the possibility of using negative interest rates to prevent the euro from appreciating.
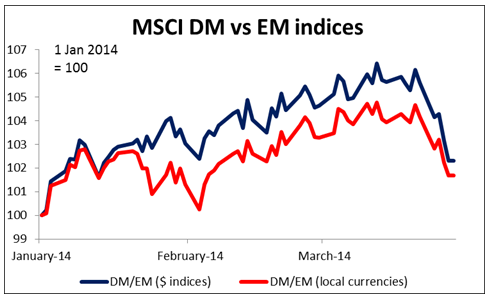
The other big theme in the market is the recovery in EM currencies. BRL led the way yesterday with a stunning gain of nearly 2% despite the recent downgrade of the country. Investors are apparently re-entering carry trades (perhaps with EUR as a funding currency?) as confidence and risk appetite return. The crisis in Ukraine has apparently stabilized and does not seem to be leading any further, while Chinese equities have recovered somewhat from their lows of last Thursday, leading to increased confidence in the asset class. EM stocks for example have been outperforming DM stocks recently. Apparently the FOMC shock has waned and the search for yield continues. TRY, RUB and ZAR are among the highest-yielding currencies (focusing on those that retail clients can access). Risk-takers might want to consider looking at those, although I expect RUB in particular to be vulnerable to capital outflows in the future.
Overnight the usual end-of-month data dump from Japan left USD/JPY virtually unchanged. The national CPI for February came in as expected at 1.5% yoy, up from 1.4%, while the Tokyo CPI for March rose by more than expected at +1.3 yoy vs 1.2% expected (previous: 1.1%). But in both cases, the pace of increase of the core CPI (excluding fresh food and energy) was far below that of the overall CPI – in fact, in Tokyo the pace of increase of core CPI actually slowed to +0.4% yoy from +0.5%. Thus it still seems that the so-called rise in inflation in Japan is not much more than a rise in energy prices, which amounts in effect to a tax on household incomes. Supressing household incomes will reduce national savings, and since the current account surplus is the difference between savings and investment, it will cause the current account surplus to shrink (unless of course investment falls too, which would not be a good sign, and would probably encourage capital outflows). Thus the scene still seems to be set for a weaker yen. Looking just at the rise in headline inflation though it could in theory be JPY-positive as it means less pressure on the Bank of Japan to increase its monetary stimulus, but we’ll have to wait until after April to see the impact of the rise in the consumption tax to determine what the Bank is likely to do.
During the European day, the third estimate of the UK GDP for Q4 is expected to remain at +0.7% qoq, which was the second estimate. Sweden’s retail sales are forecast to have accelerated in February, while Norway’s unemployment rate for March is expected to see no changes.
In the US, personal income in February is expected to have risen at the same pace as in January, while personal spending is estimated to have slowed. The core PCE deflator for the same month, the Fed’s preferred inflation gauge, is expected to have remained at +1.1% yoy. The University of Michigan final consumer sentiment for March is estimated to rise to 80.5 from 79.9 in February.
As for speakers, in addition to the two ECB speakers mentioned above, Kansas City Fed President Esther George will speak about the US economic outlook and monetary policy.
The Market
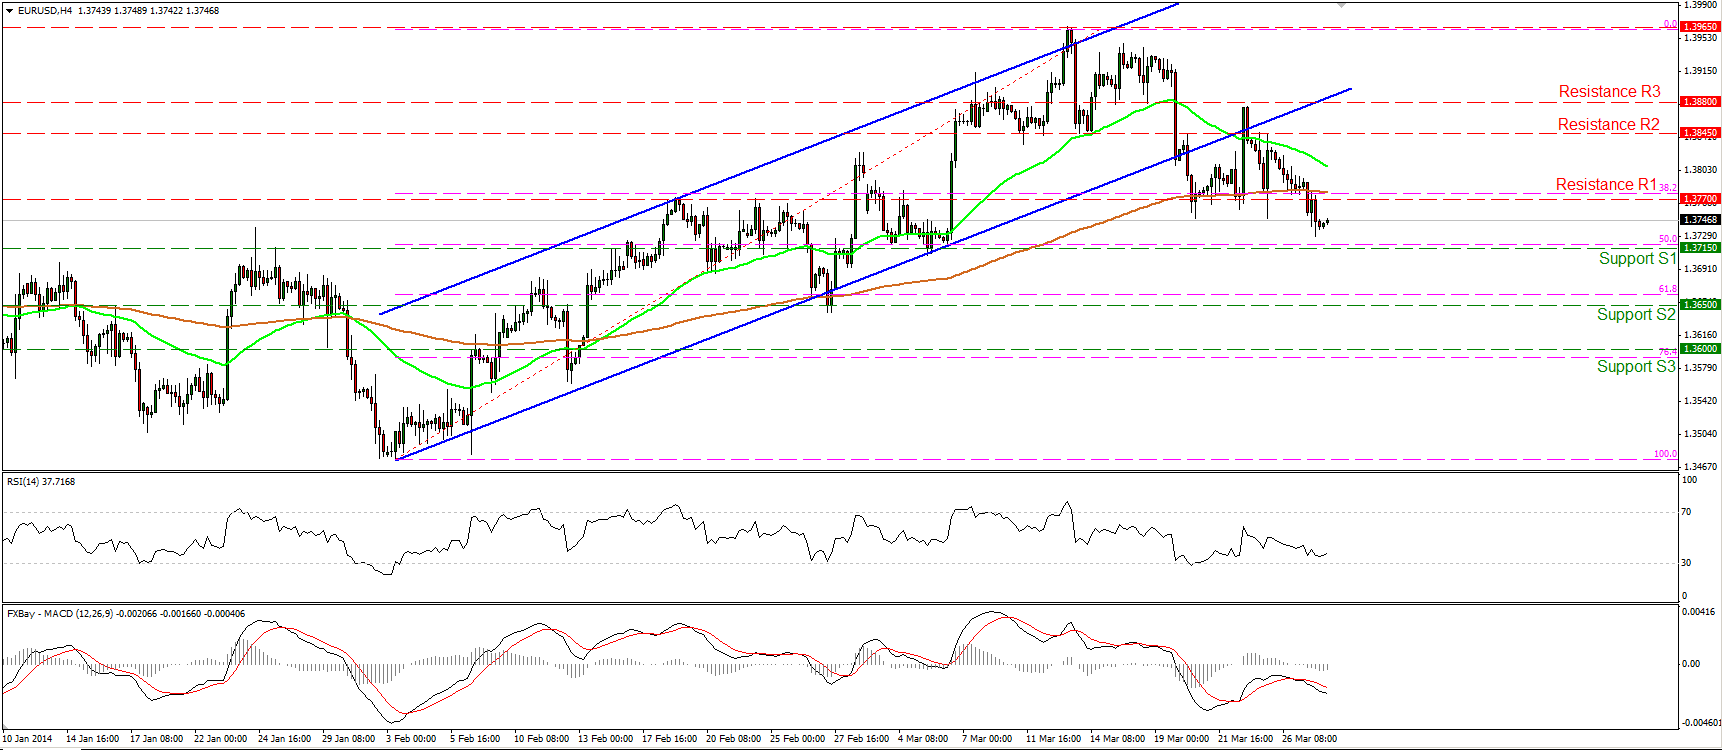
EUR/USD moved lower on Thursday and managed to break below the 1.3770 key hurdle and the 200-period moving average. The rate is now trading between that bar and the support of 1.3715 (S1). I would expect the bears to challenge the support of 1.3715 (S1), near the 50% retracement of the 3rd Feb. – 13th Mar. short-term uptrend. A dip below that bar may trigger extensions towards the next support at 1.3650 (S2), near the 61.8% retracement of the aforementioned advance.
• Support: 1.3715 (S1), 1.3650 (S2), 1.3600 (S3).
• Resistance: 1.3770 (R1), 1.3845 (R2), 1.3880 (R3).
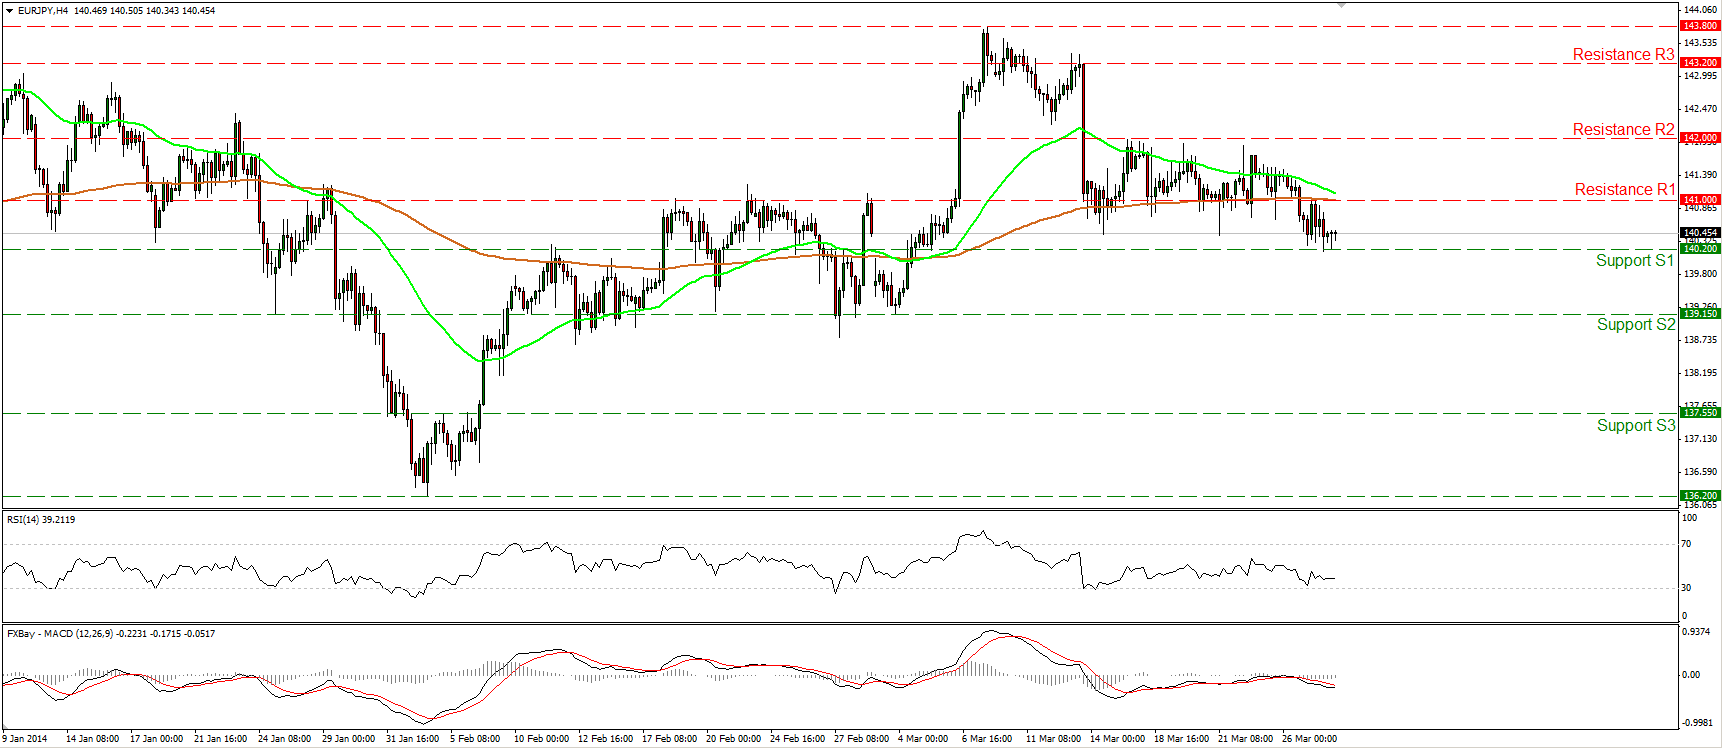
EUR/JPY fell below the 141.00 hurdle and the 200-period moving average, but the decline was halted at 140.20 (S1) A decisive dip below that support level may have larger bearish implications and target the next support at 139.15 (S2). Both momentum studies follow downward paths, while the MACD lies below both its trigger and zero lines and since the rate is trading below both the moving averages, the short-term outlook is mildly negative, in my view.
• Support: 140.20 (S1), 139.15 (S2), 137.55 (S3).
• Resistance: 141.00 (R1), 142.00 (R2), 143.20 (R3).
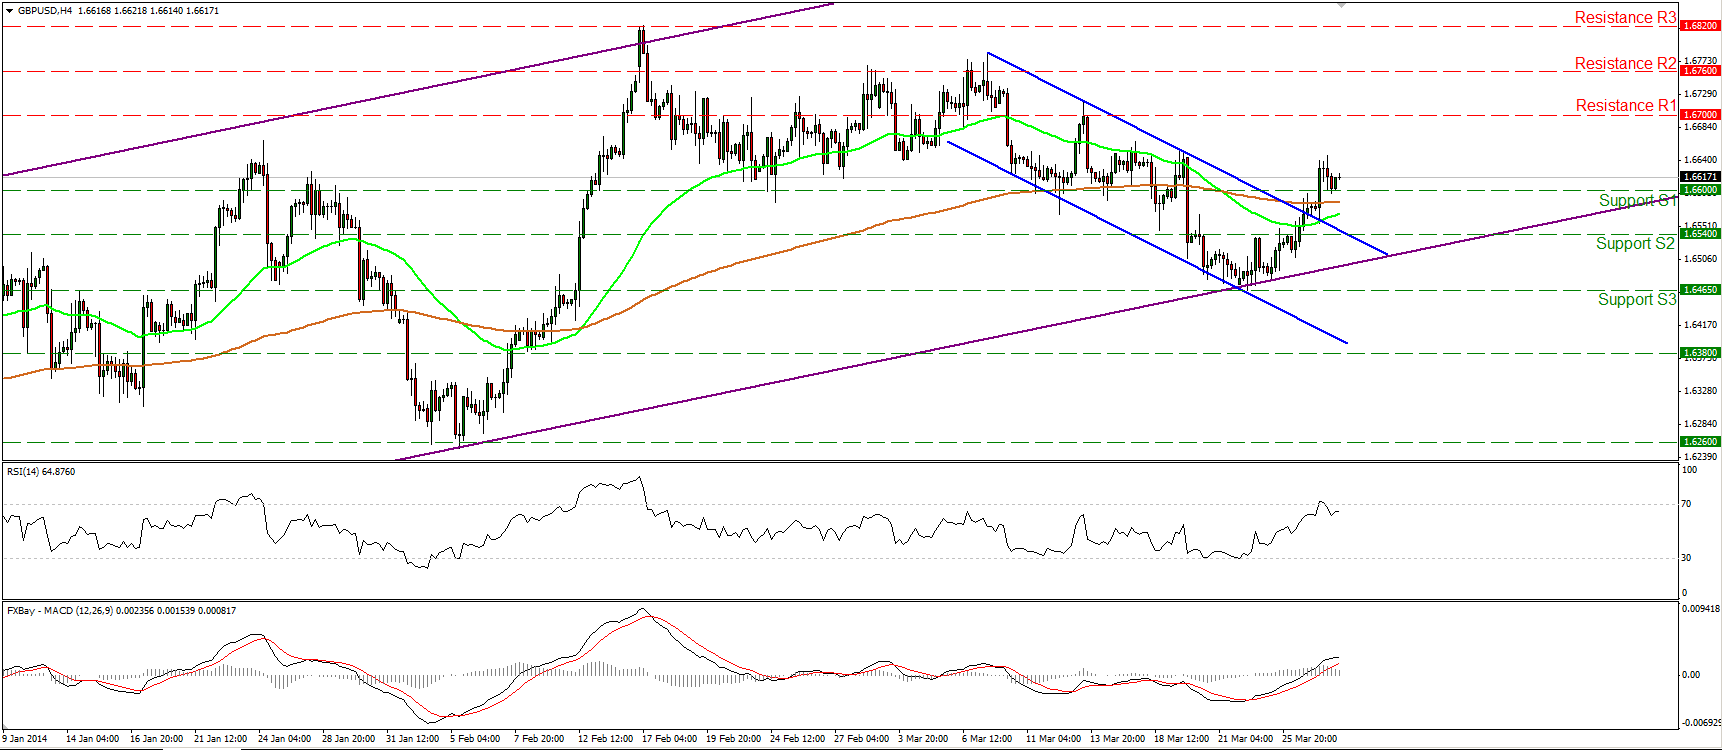
GBP/USD moved higher, breaking above the upper boundary of the short-term downtrend channel and the 1.6600 (S1) key hurdle. The rate remains within the long-term upward sloping channel and if the longs are strong enough to maintain the rate above the 1.6600 (S1) support, I would expect them to challenge the 1.6700 (R1) resistance level. My only concern is that the negative divergence between the daily uptrend and our daily momentum studies is still intact, indicating decelerating upside momentum.
• Support: 1.6600 (S1), 1.6540 (S2), 1.6465 (S3).
• Resistance: 1.6700 (R1), 1.6760 (R2), 1.6820 (R3).
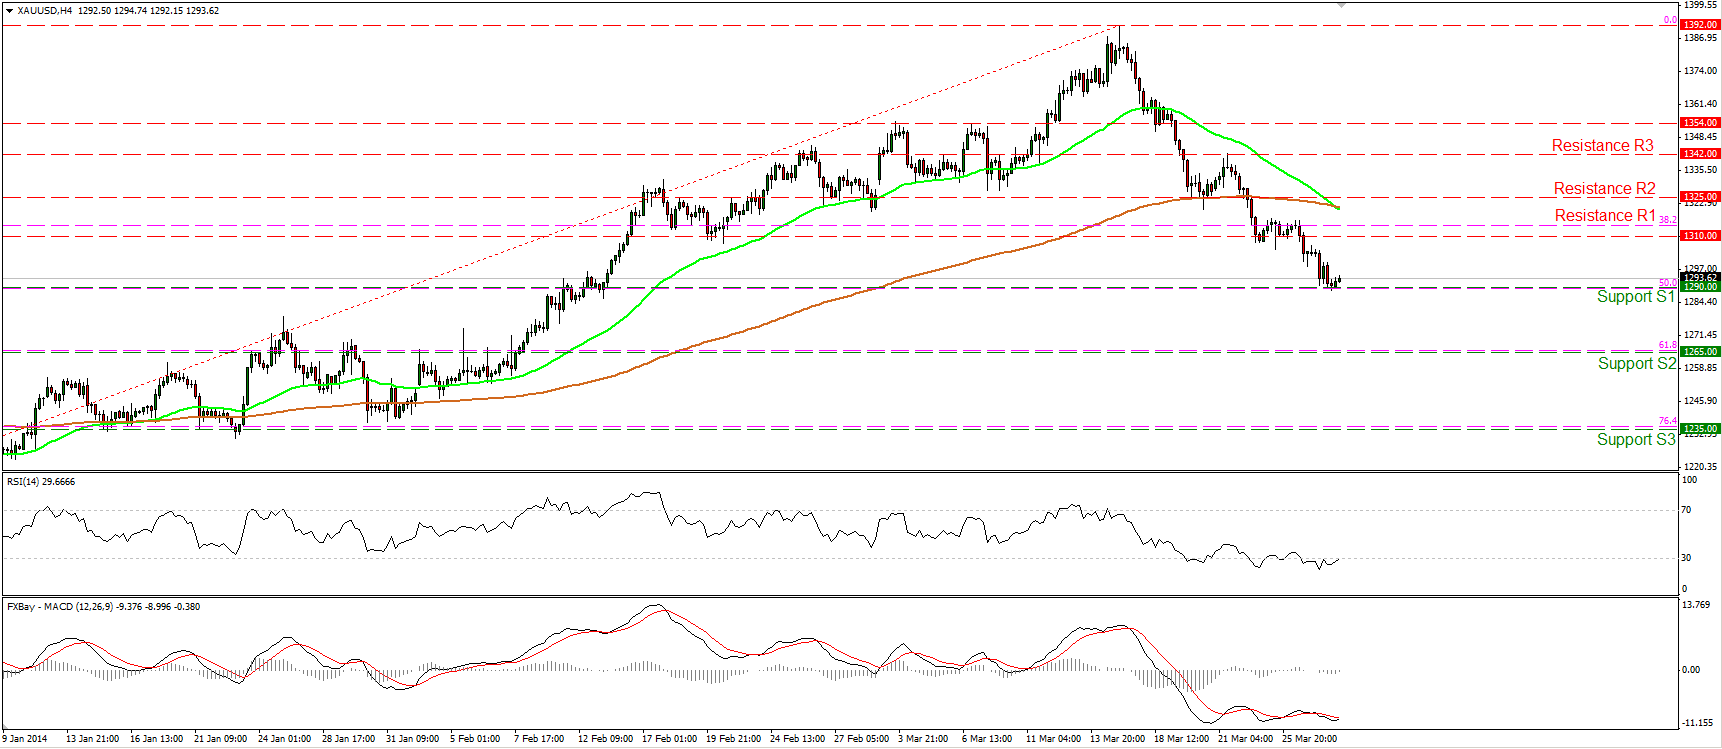
Gold continued moving lower and reached 1290 (S1), which coincides with the 50% retracement level of the 20th Dec. - 14th Mar. advance. A break below that bar may pave the way for a 61.8% retracement of the aforementioned advance, which would take the price to 1265 (S2). The 50-period moving average crossed below the 200-period moving average and this is an additional negative indication. Nonetheless, the RSI is trying once again to exit its oversold territory, thus some consolidation or an upward corrective wave cannot be ruled out. A long as the precious metal is printing lower highs and lower lows below both the moving averages, the short term outlook remains to the downside.
• Support: 1290 (S1), 1265 (S2), 1235 (S3).
• Resistance: 1310 (R1), 1325 (R2), 1342 (R3).
Oil
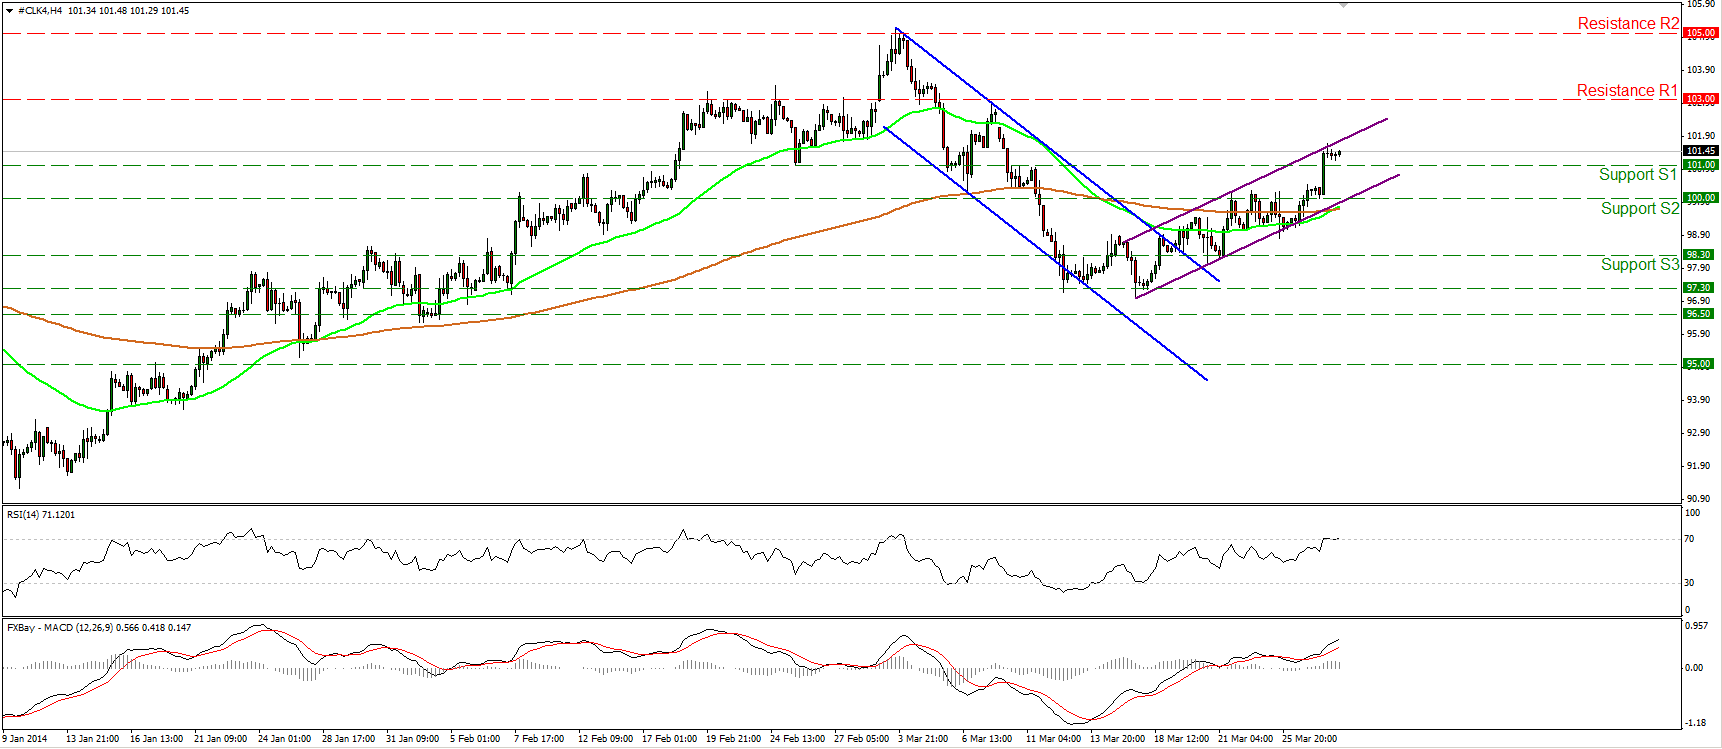
WTI moved higher and managed to reach and break the 101.00 barrier. I would expect the uptrend to continue and target the 103.00 (R1) hurdle. Nonetheless, the price met resistance at the upper boundary of the purple upward sloping channel, while the RSI is trading near its 70 bar, thus a corrective move within the channel is possible before the bulls prevail again. As long as WTI is trading within the aforementioned channel, the short-term picture remains positive.
• Support: 101.00 (S1), 100.00 (S2), 98.30 (S3).
• Resistance: 103.00 (R1), 105.00 (R2), 108.00 (R3).
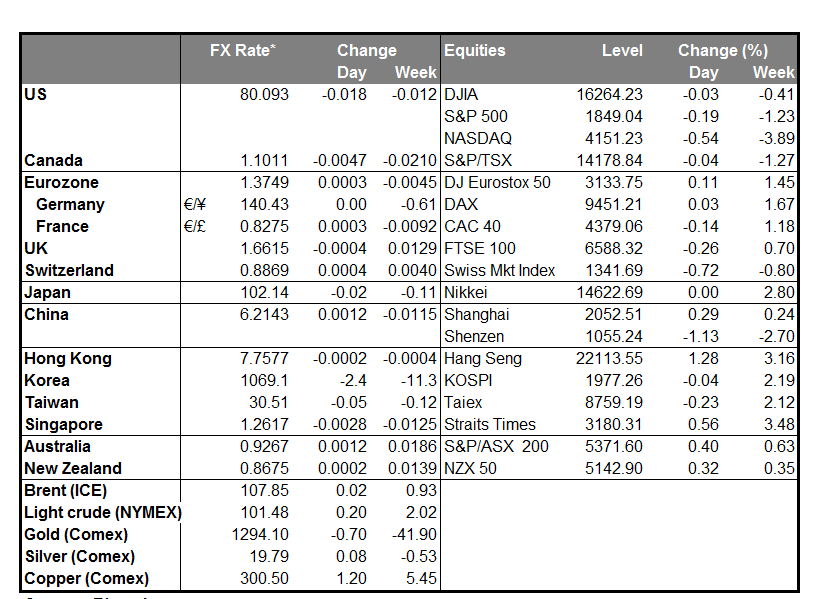
BENCHMARK CURRENCY RATES - DAILY GAINERS AND LOSERS
MARKETS SUMMARY
Disclaimer: This information is not considered as investment advice or investment recommendation but instead a marketing communication. This material has not been prepared in accordance with legal requirements designed to promote the independence of investment research, and that it is not subject to any prohibition on dealing ahead of the dissemination of investment research. IronFX may act as principal (i.e. the counterparty) when executing clients’ orders. This material is just the personal opinion of the author(s) and client’s investment objective and risks tolerance have not been considered. IronFX is not responsible for any loss arising from any information herein contained. Past performance does not guarantee or predict any future performance.
Redistribution of this material is strictly prohibited. Risk Warning: Forex and CFDs are leveraged products and involves a high level of risk. It is possible to lose all your capital. These products may not be suitable for everyone and you should ensure that you understand the risks involved. Seek independent advice if necessary. IronFx Financial Services Limited is authorised and regulated by CySEC (Licence no. 125/10). IronFX UK Limited is authorised and regulated by FCA (Registration no. 585561). IronFX (Australia) Pty Ltd is authorized and regulated by ASIC (AFSL no. 417482)

