Long Dollar Trade
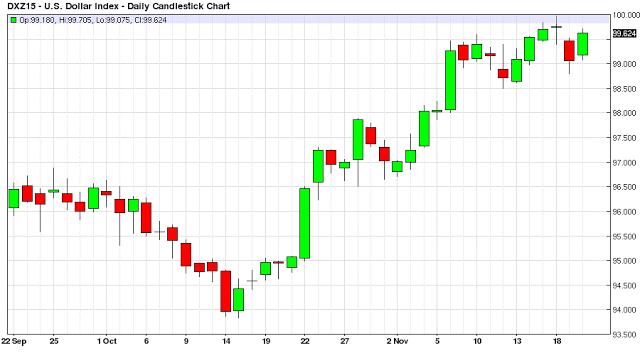
One of the common trades in financial markets these days is going long the US dollar and shorting Commodities, especially the precious and industrial metals. This has been a bad year for commodities, and this trade has picked up steam with large fund flows the last 6 weeks.
Schizophrenic Fed & Employment Reports
This all turned around after the poor employment report of October 2nd, followed by some trade unwinding thinking the Federal Reserve may be on hold for the remainder of the year after the dismal October Employment Report. This resulted in about eight days of currency unwinds and around October 14th, Investors started putting the Long Dollar Trade back on as they realized the Fed still wanted to raise rates, and since China seemed to stabilize from a crashing standpoint, Fed Speak became hawkish to telegraph to financial markets that the December meeting was a potential live meeting for a rate rise. This trade really picked up speed when the November 6th Employment Report came in much stronger than anticipated with a robust 271,000 new jobs created for the previous month.
Trading Algos & Paper Markets
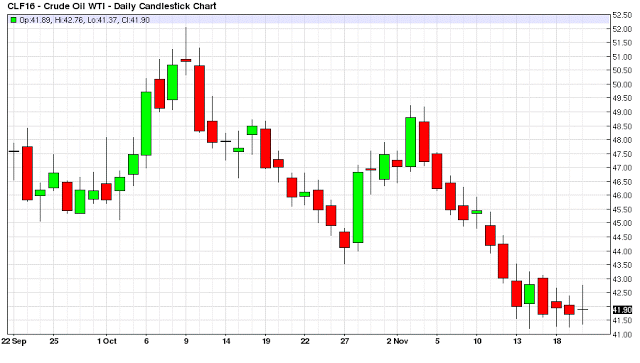
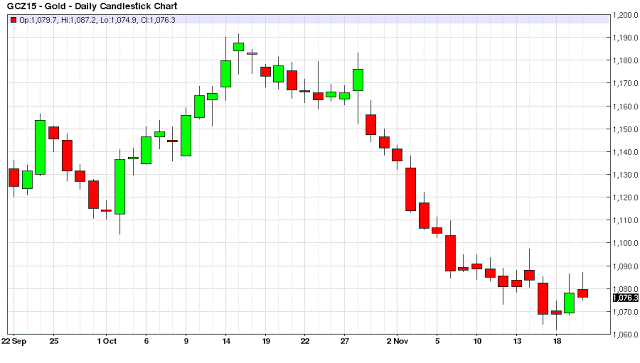
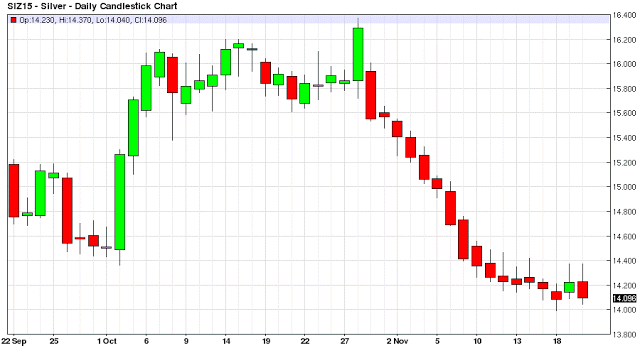
Oil has also been hit along with the metals but it has inventory issues to contend with and is in the midst of a price war for market share. But there is no such price war in the metals industry, and although China`s weakness has no doubt tempered demand, the precious and industrial metals are basically being hammered down in the paper markets by fund flows in this Long Dollar Trade. This trade has become such a reflexive trade, that if the US Dollar is strong, the trading algos just start attacking gold, silver, copper, aluminum, platinum and palladium. These metals by and large trade as a group with slight differences in the charts based upon any unique demand characteristics of the given metal.
Soft Demand
Demand hasn`t really fluctuated much for any of these metals the last six weeks, China and the global economy are just sort of trudging along with China`s rebalancing and the global economy growing somewhere in the area of 3.5%. But what has changed the last 6 weeks is the large fund flows into the US Dollar all trying to front run the Federal Reserve, and shorting the euro, (which makes up the largest component in the US dollar index), with traders also front running Mario Draghi who has been telegraphing more future stimulus for the European Union.
No Shale Technology for Copper Mining
But at some point every asset has a price, it really comes down to price, markets often over shoot in one direction or the other, but ultimately, what is a ‘fair price’ given the dynamics in the market.
Copper is an interesting market because it is being slammed down with gold and oil, and the supply side of the copper market has had its issues in 2015, with supply constraints limiting new supply on the market. Most of the pressures have come from the demand side of the equation with China`s rebalancing. But copper doesn`t grow on trees, and is actually rather difficult to get out of the ground and process from a cost perspective. The steps involved in actually processing copper to get it in a marketable form are rather extensive and involve considerable resources. And with six straight weeks of slamming down by traders we have reached the low level of $2 on the Nymex December Futures contract.
Marginal versus Production Processing Costs
There are various estimates for what the Marginal Cost of getting copper out of the ground is before supply is taken offline completely. But it is reasonable to assume that copper is currently being priced well below the long term Production Cost of Processing the Industrial Metal, and a large component for this trend is strictly fund flows in the Long Dollar Trade.
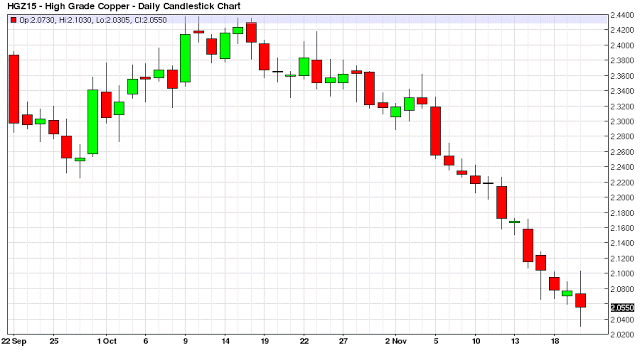
Path Forward for Copper
I am not sure how much this trade has left in it for the near term, who literally knows with asset prices and financial markets these days. But my intuition is that this Long Dollar Trade will probably be pushed into the European Central Bank Decision regarding more stimulus measures and the Fed December Meetings regarding a 25 basis point hike. Also, two other contributing factors are the December 4th Employment Report and traders wanting to take profits before the actual event in early December.
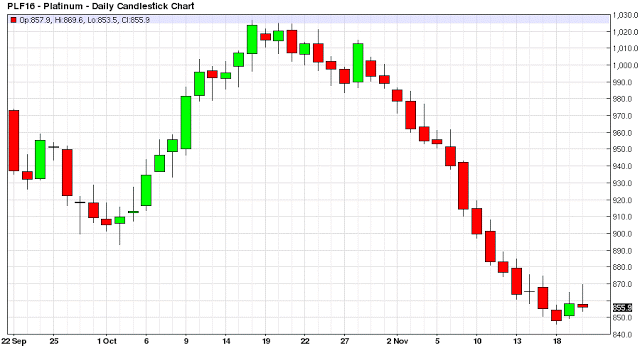
Buy the Rumor, Sell the News
And given the fact that the Federal Reserve is probably going to go out of its way to talk dovish with a 25 basis point rate hike, almost a “One and Done” intended messaging given what the rest of the world is doing in this robust currency devaluation game; it probably means that traders buy the rumor, and sell the US dollar hard after the actual news of a rate hike, at least in the near term.
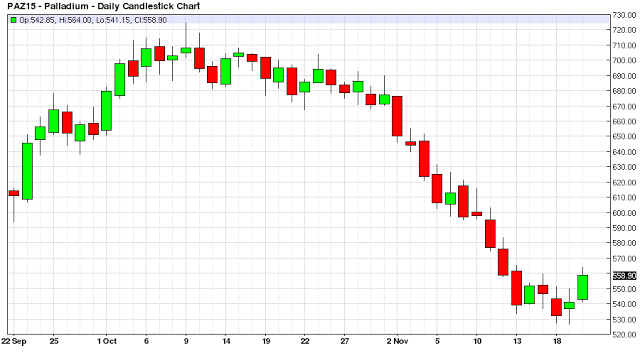
Short Covering Rally
This is when traders will probably really unwind these Fund Flows with buying gold hand over fist, covering the substantial shorts in the market, and simultaneously putting new money to work in gold and the rest of the Industrial and Precious Metals. And if it starts getting cold oil might even get a bid along with these commodities. We shall see how this all plays out in the market, but $2 copper could be setting up for an ample short covering rally before 2015 ends!
