

The latest data for the weekly Commitment of Traders (COT) report, released by the Commodity Futures Trading Commission (CFTC) on Friday, showed that large traders and currency speculators pushed their overall US dollar bullish bets higher last week for a fourth straight week and to the highest overall level since May 2013.
Non-commercial large futures traders, including hedge funds and large speculators, had an overall US dollar long position totaling $43.04 billion as of Tuesday October 14th, according to the latest data from the CFTC and dollar amount calculations by Reuters. This was a weekly change of +$2.13 billion from the $40.91 billion total long position that was registered on October 7th, according to the Reuters calculation that totals the US Dollar Index contracts against the combined contracts of the euro, British pound, Japanese yen, Australian dollar, Canadian dollar and the Swiss franc.
The US dollar’s fourth week of gains increased the aggregate bullish position to a new highest speculative level since May 28th 2013 when the total long position was +$43.77 billion. The dollar’s position continues to be very strong and each of the tracked currencies have a net bearish position versus the dollar for a second straight week.
Overall Speculative Net Contracts

In terms of total speculative contracts, overall US dollar contracts rose for a fifth straight week last week to +331,464 contracts as of Tuesday October 14th. This was a change by +17,586 contracts from the total of +313,878 contracts as of Tuesday October 7th. This total US dollar contracts calculation takes into account more currencies than the Reuters dollar amount total and is derived by adding the sum of each individual currencies net position versus the dollar. Currency contracts used in the calculation are the euro, British pound, Japanese yen, Swiss franc, Canadian dollar, Australian dollar, New Zealand dollar and the Mexican peso.
Major Currency Weekly Levels & Changes: All currencies have net bearish position versus the USD for 2nd week

Overall changes on the week for the major currencies showed that large speculators raised their bets last week in favor of just the Japanese yen and the Mexican peso while decreasing weekly bets for the euro, British pound sterling, Swiss franc, Canadian dollar, Australian dollar and the New Zealand dollar.
Notable changes on the week for the Major Currencies:
- Euro positions fell for a 2nd week and to the lowest level since Sept 9th. The EUR/USD exchange rate, however, has stabilized over the past 2 weeks and ended the week with over a 1% rise and above the 1.2750 level
- British pound sterling positions slightly dipped further on the bearish side last week for a 2nd week. The GBP/USD spot exchange rate has also clawed back against the USD to trade above the 1.6000 level and gained for a 2nd week
- Japanese yen bets rose last week for a 2nd week and sit close to the -100,000 level. The dollar strength that pushed the USD/JPY spot rate to the 110 area stalled over the past few weeks and the USD/JPY ended last week under the 107 level
- Swiss franc bets fell last week after 2 weeks of gains. The Franc positions remain on the bearish side for a seventeenth straight week while the USD/CHF exchange rate closed the week lower and trades around the 0.9460 level
- Canadian dollar positions fell sharply lower last week and declined for a fifth week with positions at the most bearish level since June. The USD/CAD exchange rate ended the week above at the 1.1200 major level, up approximately 75 pips from the previous week’s close
- Australian dollar net positions dropped sharply again last week and fell for a sixth week to a bearish level of -30,271 contracts – the most bearish Aussie position since March. The AUD/USD finished the week modestly higher (+0.66%) to trade back above the 0.8700 level
- New Zealand dollar net positions declined for a 3rd week last week to the most bearish level since July 2013. Despite the spec position decline, the NZD/USD rose for the week by approximately +1.38% to end the week around the 0.7920 level
- Mexican peso positions rose last week after five straight weeks of declines. The peso spec positions remain on the bearish side for a 3rd week at -5,763 contracts
This latest COT data is through Tuesday October 14th and shows a quick view of how large speculators and for-profit traders (non-commercials) were positioned in the futures markets. All currency positions are in direct relation to the US dollar where, for example, a bet for the euro is a bet that the euro will rise versus the dollar while a bet against the euro will be a bet that the dollar will gain versus the euro.
Please see the individual currency charts and their respective data points below.
Weekly Charts: Large Speculators Weekly Positions vs Currency Spot Price
EuroFX:

Last Six Weeks data for EuroFX futures
| Date | Open Interest | Long Specs | Short Specs | Large Specs Net | Weekly Change |
| 09/09/2014 | 484306 | 59376 | 216881 | -157505 | 3918 |
| 09/16/2014 | 397652 | 79552 | 216701 | -137149 | 20356 |
| 09/23/2014 | 398937 | 60654 | 202619 | -141965 | -4816 |
| 09/30/2014 | 409986 | 67030 | 204555 | -137525 | 4440 |
| 10/07/2014 | 425656 | 61467 | 207679 | -146212 | -8687 |
| 10/14/2014 | 434873 | 60158 | 215500 | -155342 | -9130 |
British Pound Sterling:

Last Six Weeks data for Pound Sterling futures
| Date | Open Interest | Long Specs | Short Specs | Large Specs Net | Weekly Change |
| 09/09/2014 | 256591 | 81330 | 54603 | 26727 | 17279 |
| 09/16/2014 | 134560 | 55617 | 62198 | -6581 | -33308 |
| 09/23/2014 | 134061 | 53691 | 54741 | -1050 | 5531 |
| 09/30/2014 | 132369 | 54243 | 50654 | 3589 | 4639 |
| 10/07/2014 | 129666 | 46503 | 47578 | -1075 | -4664 |
| 10/14/2014 | 138471 | 43116 | 45953 | -2837 | -1762 |
Japanese Yen:

Last Six Weeks data for Yen Futures
| Date | Open Interest | Long Specs | Short Specs | Large Specs Net | Weekly Change |
| 09/09/2014 | 255624 | 17280 | 117953 | -100673 | 16635 |
| 09/16/2014 | 208235 | 37617 | 120799 | -83182 | 17491 |
| 09/23/2014 | 222214 | 28391 | 133813 | -105422 | -22240 |
| 09/30/2014 | 239477 | 29910 | 150788 | -120878 | -15456 |
| 10/07/2014 | 223255 | 24837 | 137388 | -112551 | 8327 |
| 10/14/2014 | 212420 | 22839 | 123986 | -101147 | 11404 |
Swiss Franc:

Last Six Weeks data for Franc futures
| Date | Open Interest | Long Specs | Short Specs | Large Specs Net | Weekly Change |
| 09/09/2014 | 77317 | 9856 | 23681 | -13825 | -658 |
| 09/16/2014 | 54929 | 12889 | 24285 | -11396 | 2429 |
| 09/23/2014 | 52124 | 8354 | 21729 | -13375 | -1979 |
| 09/30/2014 | 57223 | 11998 | 24555 | -12557 | 818 |
| 10/07/2014 | 60516 | 15509 | 27928 | -12419 | 138 |
| 10/14/2014 | 60968 | 11113 | 28666 | -17553 | -5134 |
Canadian Dollar:

Last Six Weeks data for Canadian dollar futures
| Date | Open Interest | Long Specs | Short Specs | Large Specs Net | Weekly Change |
| 09/09/2014 | 102951 | 33400 | 21770 | 11630 | 2439 |
| 09/16/2014 | 110275 | 37347 | 29803 | 7544 | -4086 |
| 09/23/2014 | 76530 | 27673 | 24609 | 3064 | -4480 |
| 09/30/2014 | 89376 | 33014 | 37580 | -4566 | -7630 |
| 10/07/2014 | 100900 | 39174 | 46626 | -7452 | -2886 |
| 10/14/2014 | 104060 | 35688 | 51855 | -16167 | -8715 |
Australian Dollar:
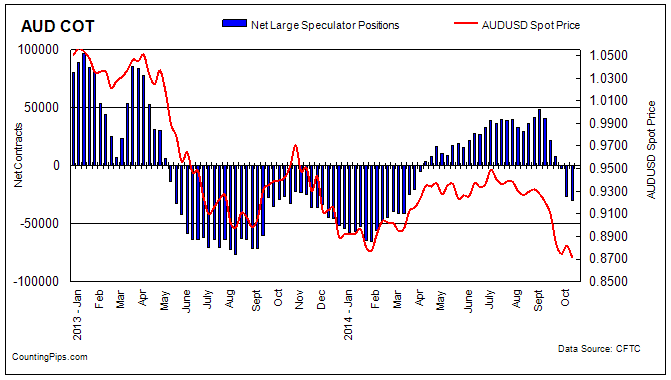
Last Six Weeks data for Australian dollar futures
| Date | Open Interest | Long Specs | Short Specs | Large Specs Net | Weekly Change |
| 09/09/2014 | 126831 | 73321 | 32092 | 41229 | -7818 |
| 09/16/2014 | 97839 | 55588 | 33448 | 22140 | -19089 |
| 09/23/2014 | 105756 | 47187 | 38840 | 8347 | -13793 |
| 09/30/2014 | 118488 | 43193 | 45210 | -2017 | -10364 |
| 10/07/2014 | 129561 | 31601 | 58087 | -26486 | -24469 |
| 10/14/2014 | 115941 | 14367 | 44638 | -30271 | -3785 |
New Zealand Dollar:
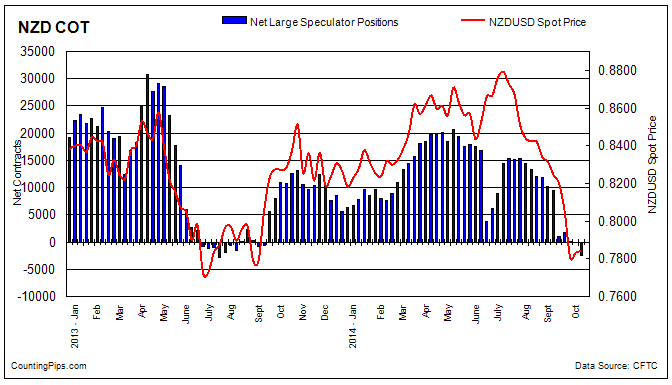
Last Six Weeks data for New Zealand dollar futures
| Date | Open Interest | Long Specs | Short Specs | Large Specs Net | Weekly Change |
| 09/09/2014 | 24920 | 14369 | 4847 | 9522 | -650 |
| 09/16/2014 | 16050 | 9814 | 8694 | 1120 | -8402 |
| 09/23/2014 | 16146 | 9779 | 7938 | 1841 | 721 |
| 09/30/2014 | 18209 | 10092 | 10028 | 64 | -1777 |
| 10/07/2014 | 19214 | 10052 | 10152 | -100 | -164 |
| 10/14/2014 | 21317 | 9171 | 11555 | -2384 | -2284 |
Mexican Peso:
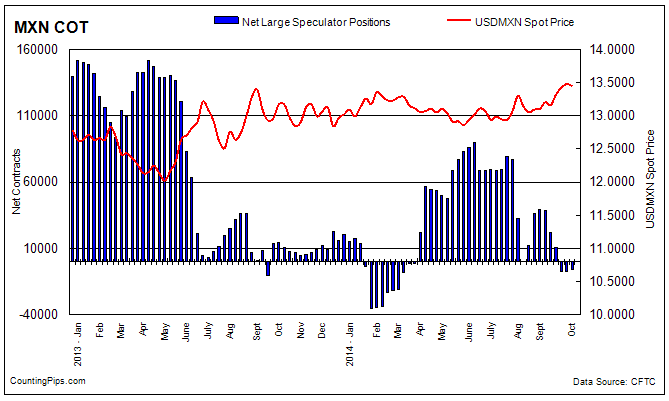
Last Six Weeks data for Mexican Peso futures
| Date | Open Interest | Long Specs | Short Specs | Large Specs Net | Weekly Change |
| 09/09/2014 | 155265 | 71021 | 32503 | 38518 | -646 |
| 09/16/2014 | 134445 | 69430 | 47384 | 22046 | -16472 |
| 09/23/2014 | 151319 | 58278 | 47774 | 10504 | -11542 |
| 09/30/2014 | 148678 | 48864 | 56178 | -7314 | -17818 |
| 10/07/2014 | 147139 | 43781 | 51364 | -7583 | -269 |
| 10/14/2014 | 139036 | 39798 | 45561 | -5763 | 1820 |
*COT Report: The weekly commitment of traders report summarizes the total trader positions for open contracts in the futures trading markets. The CFTC categorizes trader positions according to commercial hedgers (traders who use futures contracts for hedging as part of the business), non-commercials (large traders who speculate to realize trading profits) and nonreportable traders (usually small traders/speculators).
The Commitment of Traders report is published every Friday by the Commodity Futures Trading Commission (CFTC) and shows futures positions data that was reported as of the previous Tuesday (3 days behind).
Each currency contract is a quote for that currency directly against the U.S. dollar, a net short amount of contracts means that more speculators are betting that currency to fall against the dollar and a net long position expect that currency to rise versus the dollar.