
USD net speculator positions decreased last week to $39.68 billion
The latest data for the weekly Commitment of Traders (COT) report, released by the Commodity Futures Trading Commission (CFTC) on Friday, showed that large traders and currency speculators reduced their overall net bullish positions for the US dollar last week for a third straight week and to the lowest level in a month.
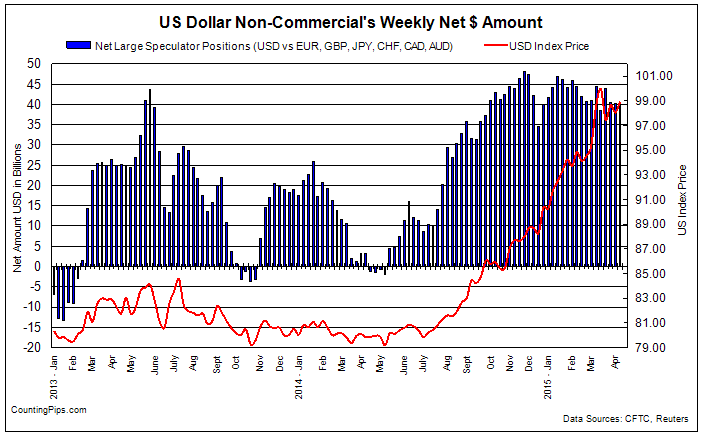
Non-commercial large futures traders, including hedge funds and large speculators, had an overall US dollar long position totaling $39.68 billion as of Tuesday April 14th, according to the latest data from the CFTC and dollar amount calculations by Reuters. This was a weekly change of -$0.59 billion from the $40.27 billion total long position that was registered on April 7th, according to the Reuters calculation that totals the US dollar contracts against the combined contracts of the euro, British pound, Japanese yen, Australian dollar, Canadian dollar and the Swiss franc.
The latest data pushes the US dollar speculative level just under the $40 billion level and to the lowest level since March 17th when the total speculative position was $38.59 billion.
Overall Speculative Net US Dollar Index Contracts
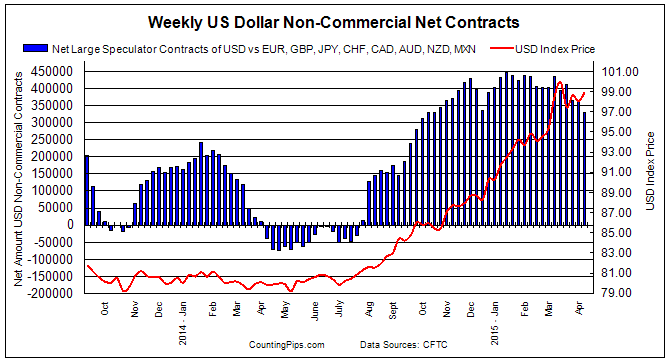
In terms of total net speculative contracts, overall US dollar contracts declined last week for a third straight week to a total of +329,939 contracts as of Tuesday April 14th. This was a weekly change of -31,396 contracts from the total of +361,335 contracts as of Tuesday April 7th.
This total US dollar contracts calculation takes into account more currencies than the Reuters dollar amount total and is derived by adding the sum of each individual currencies net position versus the dollar. Currency contracts used in the calculation are the euro, British pound, Japanese yen, Swiss franc, Canadian dollar, Australian dollar, New Zealand dollar and the Mexican peso.
Major Currency Weekly Levels & Changes: NZD, CHF & MXN are now in bullish territory against USD
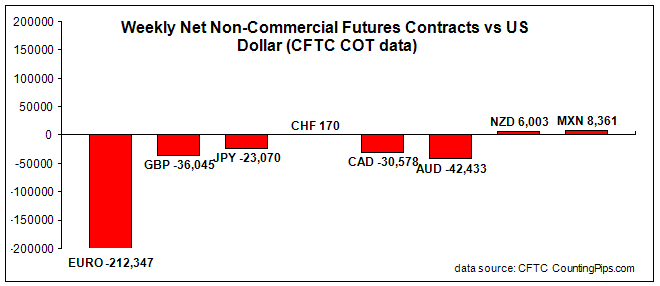
Weekly changes for the major currencies showed that large speculators increased their bets in favor of the euro, Japanese yen, Swiss franc, New Zealand dollar and the Mexican Peso while decreasing weekly bets for the British pound sterling, Canadian dollar and the Australian dollar.
Notable Changes:
- The Mexican Peso rose sharply and turned bullish vs. the USD for the first time since September 2014
- The euro bets edged higher to gain for a 2nd week to -212,347 contracts.
- Swiss franc bets edged up a bit to maintain a very slight bullish position of +170 contracts
- New Zealand dollar positions gained for a fifth week and rose higher into bullish territory (+6,003 contracts)
- British Pound(-1,744 contracts), Japanese Yen(+1,379), Australian dollar(-2,152) and Canadian dollar(-559) bets all saw rather muted weekly moves and only small changes from the previous week
This latest COT data is through Tuesday April 14th and shows a quick view of how large speculators and for-profit traders (non-commercials) were positioned in the futures markets. All currency positions are in direct relation to the US dollar where, for example, a bet for the euro is a bet that the euro will rise versus the dollar while a bet against the euro will be a bet that the dollar will gain versus the euro.
Please see the individual currency charts and their respective data points below.
Weekly Charts: Large Speculators Weekly Positions vs Currency Spot Price
EuroFX:

Last Six Weeks data for EuroFX futures
| Date | Open Interest | Long Specs | Short Specs | Large Specs Net | Weekly Change |
| 03/10/2015 | 496465 | 61271 | 242344 | -181073 | -8684 |
| 03/17/2015 | 449508 | 56329 | 250103 | -193774 | -12701 |
| 03/24/2015 | 460950 | 50148 | 271111 | -220963 | -27189 |
| 03/31/2015 | 459746 | 41709 | 268269 | -226560 | -5597 |
| 04/07/2015 | 441624 | 39444 | 254702 | -215258 | 11302 |
| 04/14/2015 | 453518 | 45264 | 257611 | -212347 | 2911 |
British Pound Sterling:

Last Six Weeks data for Pound Sterling futures
| Date | Open Interest | Long Specs | Short Specs | Large Specs Net | Weekly Change |
| 03/10/2015 | 205166 | 48053 | 80644 | -32591 | -5683 |
| 03/17/2015 | 188238 | 47155 | 85006 | -37851 | -5260 |
| 03/24/2015 | 178140 | 35938 | 74495 | -38557 | -706 |
| 03/31/2015 | 182514 | 35143 | 71773 | -36630 | 1927 |
| 04/07/2015 | 185219 | 37641 | 71942 | -34301 | 2329 |
| 04/14/2015 | 189513 | 33993 | 70038 | -36045 | -1744 |
Japanese Yen:

Last Six Weeks data for Yen Futures
| Date | Open Interest | Long Specs | Short Specs | Large Specs Net | Weekly Change |
| 03/10/2015 | 235089 | 32898 | 92285 | -59387 | -6866 |
| 03/17/2015 | 195913 | 44496 | 92550 | -48054 | 11333 |
| 03/24/2015 | 181026 | 39156 | 85061 | -45905 | 2149 |
| 03/31/2015 | 177478 | 44409 | 68333 | -23924 | 21981 |
| 04/07/2015 | 189444 | 53320 | 77769 | -24449 | -525 |
| 04/14/2015 | 195230 | 54783 | 77853 | -23070 | 1379 |
Swiss Franc:

Last Six Weeks data for Franc futures
| Date | Open Interest | Long Specs | Short Specs | Large Specs Net | Weekly Change |
| 03/10/2015 | 52384 | 7217 | 15597 | -8380 | -2318 |
| 03/17/2015 | 38889 | 18129 | 15894 | 2235 | 10615 |
| 03/24/2015 | 36296 | 12604 | 16559 | -3955 | -6190 |
| 03/31/2015 | 34149 | 13679 | 12973 | 706 | 4661 |
| 04/07/2015 | 33245 | 12746 | 12626 | 120 | -586 |
| 04/14/2015 | 33935 | 12240 | 12070 | 170 | 50 |
Canadian Dollar:

Last Six Weeks data for Canadian dollar futures
| Date | Open Interest | Long Specs | Short Specs | Large Specs Net | Weekly Change |
| 03/10/2015 | 146639 | 22011 | 61041 | -39030 | -167 |
| 03/17/2015 | 158576 | 21001 | 53823 | -32822 | 6208 |
| 03/24/2015 | 106731 | 19193 | 51849 | -32656 | 166 |
| 03/31/2015 | 110447 | 18771 | 48389 | -29618 | 3038 |
| 04/07/2015 | 114881 | 22081 | 52100 | -30019 | -401 |
| 04/14/2015 | 118686 | 23020 | 53598 | -30578 | -559 |
Australian Dollar:

Last Six Weeks data for Australian dollar futures
| Date | Open Interest | Long Specs | Short Specs | Large Specs Net | Weekly Change |
| 03/10/2015 | 196534 | 15137 | 91988 | -76851 | -15306 |
| 03/17/2015 | 152746 | 63046 | 91853 | -28807 | 48044 |
| 03/24/2015 | 135693 | 52079 | 80447 | -28368 | 439 |
| 03/31/2015 | 138260 | 55814 | 80170 | -24356 | 4012 |
| 04/07/2015 | 159532 | 55928 | 96209 | -40281 | -15925 |
| 04/14/2015 | 161971 | 55077 | 97510 | -42433 | -2152 |
New Zealand Dollar:

Last Six Weeks data for New Zealand dollar futures
| Date | Open Interest | Long Specs | Short Specs | Large Specs Net | Weekly Change |
| 03/10/2015 | 29726 | 13347 | 15827 | -2480 | -1113 |
| 03/17/2015 | 23317 | 13117 | 14258 | -1141 | 1339 |
| 03/24/2015 | 20958 | 12149 | 13015 | -866 | 275 |
| 03/31/2015 | 24049 | 16443 | 12412 | 4031 | 4897 |
| 04/07/2015 | 24920 | 16950 | 11172 | 5778 | 1747 |
| 04/14/2015 | 25176 | 17081 | 11078 | 6003 | 225 |
Mexican Peso:

Last Six Weeks data for Mexican Peso futures
| Date | Open Interest | Long Specs | Short Specs | Large Specs Net | Weekly Change |
| 03/10/2015 | 185039 | 30622 | 66269 | -35647 | 7760 |
| 03/17/2015 | 135144 | 23702 | 79641 | -55939 | -20292 |
| 03/24/2015 | 150320 | 35044 | 76144 | -41100 | 14839 |
| 03/31/2015 | 157688 | 43289 | 73578 | -30289 | 10811 |
| 04/07/2015 | 151072 | 42185 | 65110 | -22925 | 7364 |
| 04/14/2015 | 130501 | 63521 | 55160 | 8361 | 31286 |
*COT Report: The weekly commitment of traders report summarizes the total trader positions for open contracts in the futures trading markets. The CFTC categorizes trader positions according to commercial hedgers (traders who use futures contracts for hedging as part of the business), non-commercials (large traders who speculate to realize trading profits) and nonreportable traders (usually small traders/speculators).
The Commitment of Traders report is published every Friday by the Commodity Futures Trading Commission (CFTC) and shows futures positions data that was reported as of the previous Tuesday (3 days behind).