Get 40% Off
👀 👁 🧿 All eyes on Biogen, up +4,56% after posting earnings. Our AI picked it in March 2024.
Which stocks will surge next?
Unlock AI-picked Stocks

Crude's Downside Leaning Is Refreshed

Published 03/24/2015, 06:54 AM
Updated 07/09/2023, 06:31 AM

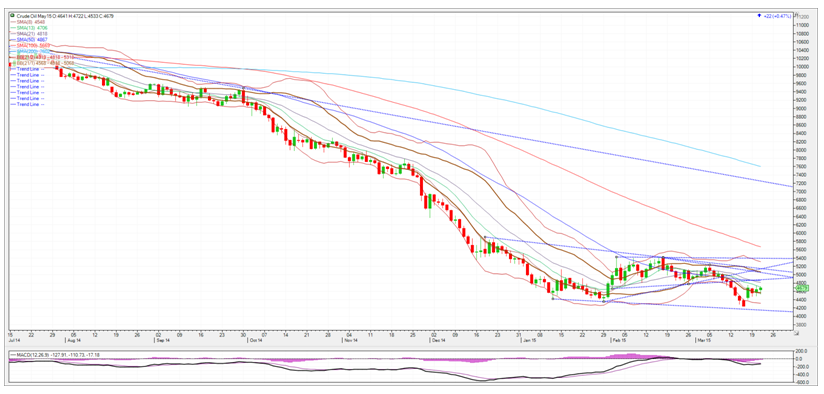
Since taking off from the new lows of 42.41 established on Tuesday March 17th, crude oil is coiling. Trade has been contained within the trading range of the March 18th rally to the 47.48 high and its 44.07 low. The rally on Friday to 47.43 failed to take out the high and formed a small body candle with shadows on both sides (a Spinning Top). Crude needs to break out from Wednesdays candle to create energy for its next move. Trading above this high would set up the 21 DMA as a potential target for crude oil up at 48.18. Trading below the low would set up a run to lows testing the trendline down at 41.79.

A rally in crude would be difficult to maintain with the downward crossover of the 21 and 50 DMAs, in my opinion. Plus, the short-term moving averages crossed over to the downside after trying to cross up. Crude’s downside leaning is refreshed. Crude also has the long-term moving averages pointing down. It would take a couple of closes above the 50 DMA to signify a change in sentiment, in my opinion. This would push MACD above the zero line and add credence to the sentiment change. I therefore believe rallies should be sold into and buying put spreads on rallies would be a way to take advantage of this scenario.

Trading below the lows keeps the downtrend intact and putting the 40.00 level as a potential mark. A break of this level could send Crude to the 37 area where buyers should appear. If buyers refuse to enter here, Crude could test the lows from February 2009 at 33.55. I therefore propose the following trade. Look at buying the May Crude 40.00 put and selling one May crude 37 put for 20 cents, or in cash value $200.00. The risk on the trade is the price paid for the spread plus all commissions and fees.
3rd party Ad. Not an offer or recommendation by Investing.com. See disclosure here or remove ads .

Crude Oil Chart

Latest comments

Risk Disclosure: Trading in financial instruments and/or cryptocurrencies involves high risks including the risk of losing some, or all, of your investment amount, and may not be suitable for all investors. Prices of cryptocurrencies are extremely volatile and may be affected by external factors such as financial, regulatory or political events. Trading on margin increases the financial risks.
Before deciding to trade in financial instrument or cryptocurrencies you should be fully informed of the risks and costs associated with trading the financial markets, carefully consider your investment objectives, level of experience, and risk appetite, and seek professional advice where needed.
Fusion Media would like to remind you that the data contained in this website is not necessarily real-time nor accurate. The data and prices on the website are not necessarily provided by any market or exchange, but may be provided by market makers, and so prices may not be accurate and may differ from the actual price at any given market, meaning prices are indicative and not appropriate for trading purposes. Fusion Media and any provider of the data contained in this website will not accept liability for any loss or damage as a result of your trading, or your reliance on the information contained within this website.
It is prohibited to use, store, reproduce, display, modify, transmit or distribute the data contained in this website without the explicit prior written permission of Fusion Media and/or the data provider. All intellectual property rights are reserved by the providers and/or the exchange providing the data contained in this website.
Fusion Media may be compensated by the advertisers that appear on the website, based on your interaction with the advertisements or advertisers.
© 2007-2024 - Fusion Media Limited. All Rights Reserved.