Forex News and Events
Iraq request exemption from oil production cut (by Peter Rosenstreich)
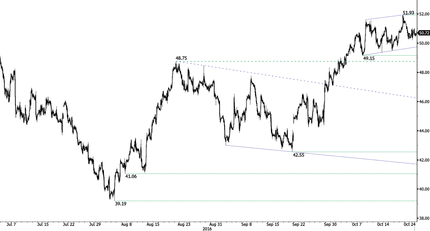
Well, it did not take long for the much-hyped OPEC coordinated production cuts to naturally unravel. The Nov. 30th OPEC meeting in Vienna should already be discounted as a bust. Recent headlines indicate that Iraq is looking for an exemption from the OPEC cuts suggesting that war with Islamic militants qualified them for additional crude revenues. This follows Libya, Iran and Nigeria’s search for exemption from output cuts. All the while, the chief beneficiary of the production cuts -- Russia is already refusing to comment on cuts. Oil prices have been supported for a fourth straight week on the thinking that a solid agreement would be reached in November. Without the prospect of a deal, the oil market massive oversupply is likely to dominate price action despite marginal improvement in balances. With crude prices threatening to fall below $50, the optimist higher prices generated on Wall Street earnings will quickly evaporate, suggesting weakness in US stocks. A primary rationale for higher US valuations has been based on increased forward earnings of the energy sector. Without the prospect of higher crude prices, energy becomes less attractive. In addition, without the prospect of higher oil prices, the broader commodity complex looks less appealing. We remain negative on commodity linked currencies such as NOK, CAD, and MXN as markets further discount a production cut agreement by producer cartel OPEC in November.
Unexpected surge in the manufacturing PMI (by Yann Quelenn)
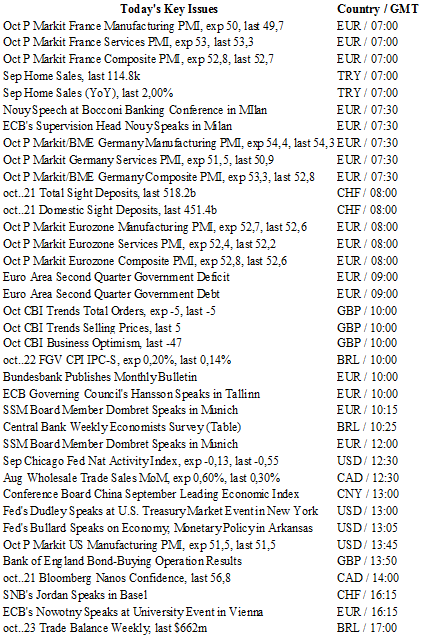
If there is one indicator that is important while assessing whether the economy is expanding or contracting, it is the Eurozone Manufacturing PMI. This morning, data printed at 53.3 vs. an expected 52.7. A reading below 50 points indicates a contraction. This print is the highest in two years.
Nevertheless, this data contradicts other economic fundamentals. In particular, investors are looking again and again for signs of an improvement in new orders growth as well as new exports business. Despite this recent pickup in the PMI indicator, the outlook does not look promising. Other data such as retail sales is heading towards the soft side, declining in August to -0.1% from July. On an annualized basis, retail sales are growing at 0.6% -- their lowest pace in two years.
There is also mounting evidence that the ECB must expand its QE program beyond March at the December meeting. Mario Draghi refused to clearly announce anything at last week’s meeting but we believe that it will be mandatory at the next meeting. Indeed, there is now further evidence that the European Central Bank won’t reach its inflation target as consumer activity remains sluggish. This is why we believe that today’s PMI is a false signal.
Crude Oil - Bouncing Within Uptrend Channel 

The Risk Today
Yann Quelenn
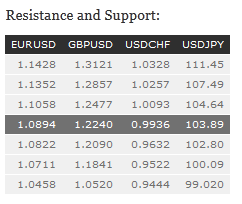
EUR/USD's bearish momentum continues. Selling pressures are important. Resistance can be given at 1.0822 (10/03/2016 low). Hourly resistance can be found at 1.1058 (13/10/2016 high). Key resistance is located far away at 1.1352 (18/08/2016 high). Expected to further weaken. In the longer term, the technical structure favours a very long-term bearish bias as long as resistance at 1.1714 (24/08/2015 high) holds. The pair is trading in range since the start of 2015. Strong support is given at 1.0458 (16/03/2015 low). However, the current technical structure since last December implies a gradual increase.
GBP/USD is well located within a symmetrical triangle. Hourly support is given around 1.2185 (lower bound of the symmetrical triangle) while hourly resistance lies at 1.2332 (19/10/2016 high). Key resistance stands far away at 1.2620 then 1.2873 (03/10/2016). Expected to show further bearish breakout. The long-term technical pattern is even more negative since the Brexit vote has paved the way for further decline. Long-term support given at 1.0520 (01/03/85) represents a decent target. Long-term resistance is given at 1.5018 (24/06/2015) and would indicate a long-term reversal in the negative trend. Yet, it is very unlikely at the moment.
USD/JPY is trading mixed. A break of hourly support at 102.81 (10/10/2016 low) is unlikely at the moment but is nonetheless needed to confirm underlying pressures. Key support can be found at 100.09 (27/09/2016). Hourly resistance can be found at 104.64 (13/10/2016 higher). Expected to see renewed selling pressures around 104.15-30. We favor a long-term bearish bias. Support is now given at 96.57 (10/08/2013 low). A gradual rise towards the major resistance at 135.15 (01/02/2002 high) seems absolutely unlikely. Expected to decline further support at 93.79 (13/06/2013 low).
USD/CHF is still lying within former resistance area between 0.9919 (07/08/2016 low) and 0.9950 (27/07/2016). The pair remains on a bullish momentum since September 15. Hourly support is located at 0.9733 (05/10/2016 base) then 0.9632 (26/08/2016 base low). Expected to see continued increase. In the long-term, the pair is still trading in range since 2011 despite some turmoil when the SNB unpegged the CHF. Key support can be found 0.8986 (30/01/2015 low). The technical structure favours nonetheless a long term bullish bias since the unpeg in January 2015.

