Talking Points:
- Crude oil fell as gasoline stock build dented demand outlook
- Gold fell on Greek debt deal hopes, upbeat US economic data
- Copper prices surged as China expanded stimulus efforts
WTI crude oil lost 74 cents or 1.26 percent in New York after the EIA weekly inventories report showed an increase in the supply of refined products, which seemed to offset the continuing fall in crudestockpiles in the minds of investors. Brent fell by 96 cents or 1.5 percent. This came amidst gasoline demand reaching the highest level since 1991. Crude oil has gained 13 percent this year as supplies shrank. The week ending June 19 saw inventories decline for the eighth week straight, putting the stockpile at 4.9 million barrels. On the other hand, gasoline supplies rose by 680,000 barrels, exceeding an expected drop of 304,000 barrels. This sent gasoline futures down 2.11 cents or 1 percent. Crude oil is now at the middle of its recent range, with seemingly few factors to induce a break out besides an unexpected deepening of the Greek debt crisis or progress in on-going negotiations to lift export sanctions on Iran.
Gold endured a sharp fall to a 2-week low of 1169.3 overnight as markets speculated on an on-coming accord between Greece and its creditors while US economic data stuck a positive tone. The night ended with no deal in Europe however and gold climbed back toward the 1175.00 area. Event risks continue to drive volatility of bullion with another Eurogroup meeting on Thursday. Any further delay in reaching a deal on Greek funding may trigger a pickup in gold demand and send prices higher. Gold has been dormant in today’s Asian session and seems likely to hold above its previous low.
Looking ahead, US data and Fed rate hike prospects continue to weigh on bullion. US first-quarter GDP came out as expected at -0.2 percent quarter-on-quarter, which was an improvement from previous estimates pointing to a -0.7 percent decline. If July and August data stays on track, chances would rise for a September rate hike and/or a two consecutive hikes scenario, which would be bad news for gold.
Copper scored the biggest two-day gain in seven weeks as China stepped up its stimulus program with the abolishment of the 75 percent lending limit on deposits. Prices jumped 17 percent on Tuesday and climbed further to 2.6500 yesterday. That amounts to a two-day gain of 2.1 percent, the most since the beginning of May. Upside momentum is also helped by a fall in stockpiles, reported across London, US and Shanghai exchanges for a sixth consecutive session. Inventories have fallen by a total of 7.4 percent this month. However, downward pressure from the Greek crisis and consequent growth worries still cap the upside for copper, with resistance found at 2.7400 marked by the 20 DMA today.
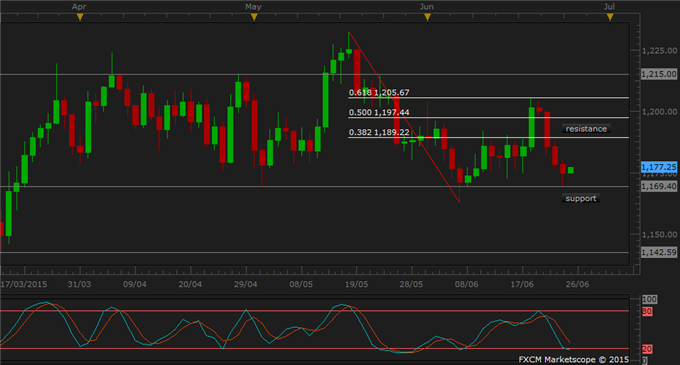
GOLD TECHNICAL ANALYSIS – Gold fell to a two-week low of 1169.30 overnight, touching a multi-week support level before opening higher near the 1175.00 area in today’s session. Gold continues to linger near the lower bound of its recent range, though no signal for a clear break of support is evident for now. A break downward exposes supports marked by daily lows in the 1174.5-1169.39 area. The topside is capped by resistance at 189.22, the 38.2% Fibonacci retracement.

Daily Chart - Created Using FXCM Marketscope
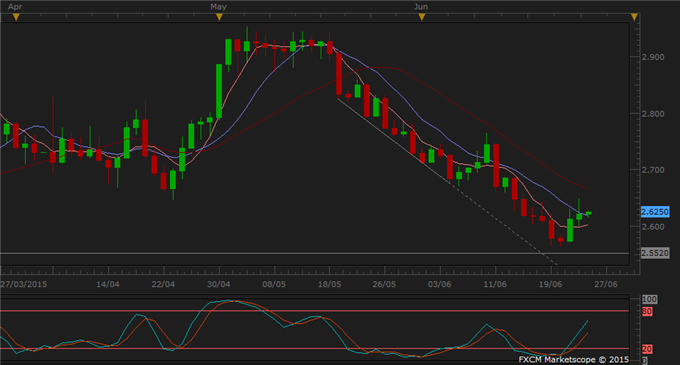
COPPER TECHNICAL ANALYSIS – Copper rose above the 10 DMA yesterday, with an upside bias heading into 20 DMA at 2.6875 and away from support at 2.5520. A forceful approach toward the 20 DMA or a break thereof would is needed to confirm lasting upside follow-through.

Daily Chart - Created Using FXCM Marketscope
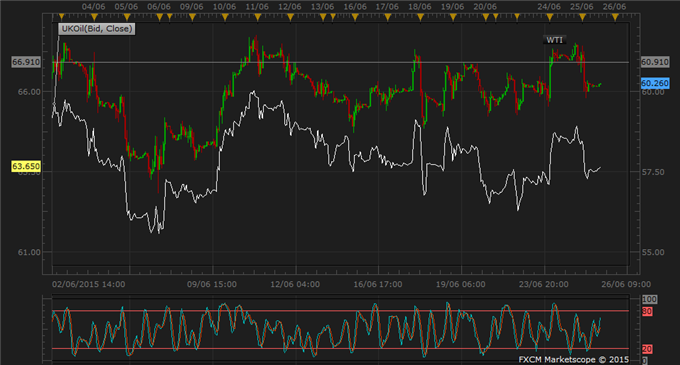
CRUDE OIL TECHNICAL ANALYSIS – WTI remains in a range having tried to advance but subsequently losing steam and retreating overnight. Daily charts show both WTI and Brent are confined within narrow trading band bounds with lackluster momentum. Support levels for WTI are past daily lows in the 59.53-59.21 area. Firm resistance is a distance above at 62.56.

