US Dollar Index TECHNICAL ANALYSIS – Prices declined as expected after negative RSI divergence hinted at ebbing upside momentum. A daily close below the 23.6% Fibonacci retracementat 11985 exposes the 38.2% level at 11937. Alternatively, a move above the 14.6% Fib at 12015 clears the way for a test of trend line support-turned-resistance at 12045.

S&P 500 TECHNICAL ANALYSIS – Prices corrected higher, snapping a sharp three-day loss streak. A break above the 38.2% Fibonacci expansion at 2097.80 exposes the 50% level at 2108.50. Alternatively, a move below the 23.6% Fib at 2084.70 targets the 14.6% expansion at 2076.60.

Gold TECHNICAL ANALYSIS – Prices are digesting losses after sliding to the weakest level in over five years. A break below the 14.6% Fibonacci expansion at 1090.20 exposes the 23.6% level at 10778.10. Alternatively, a move above the 23.6% Fib retracement at 1103.00 targets channel floor support-turned-resistance at 1109.21.

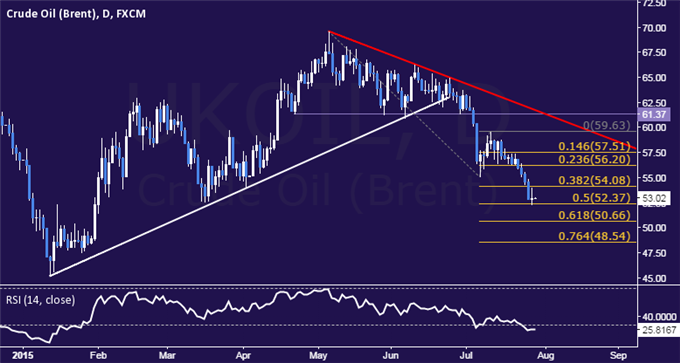
Crude Oil TECHNICAL ANALYSIS – Prices paused to consolidate four days of consecutive losses delivered the lowest levels since February. A daily close below the 50% Fibonacci expansion at 52.37 exposes the 61.8% level at 50.66. Alternatively, a reversal above the 38.2% Fib at 54.08 targets the 23.6% expansion at 56.20.