There has been near-capitulation in the commodity markets that closely resembles what happen in 2008, as the back drop of global growth worsens and the US dollar maintains its strength.
Economically driven commodities, such as iron ore and copper, are making multi-year lows. Lumber, which is closely related to the U.S. housing sector, is retesting current cyclical lows.
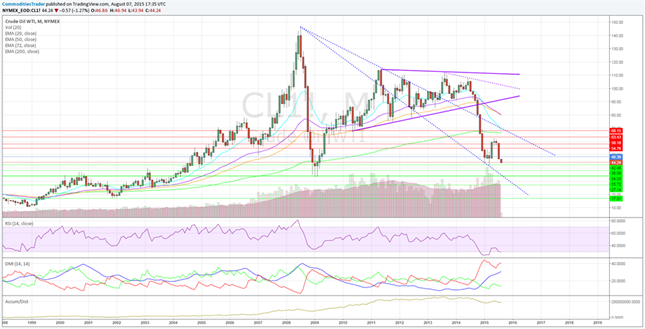
Yet, everyone on Wall Street is surprised that crude is re-approaching longer-term price support of $42 per barrel (just above oil's inflation-adjusted price of $41.70).
What was a hedge fund's go-to levered carry trade, the unraveling narrative of global demand has made life hard for traders.
Crude trader Andy Hall, who has been referred to as "God" by fellow traders, lost his grace and quickly fallen to Earth. Unable to break the Wall Street frame-of-mind, Hall's Astenbeck Capital lost $500 million, or 17 percent on trades that went sour; and that was just in July.
In February, after calling crude's cycle low, rebound, and then subsequent lower-low, I wrote:
"A bottom in crude will not likely begin until fundamentals mingle with price action. Inventory builds of 5, 6, 10 million barrels per week will not help the case for higher prices, and oil companies could be forced to further slash rigs, jobs and CAPEX. And considering the deteriorating economic data, more so in the US, 2009′s low could be retested."
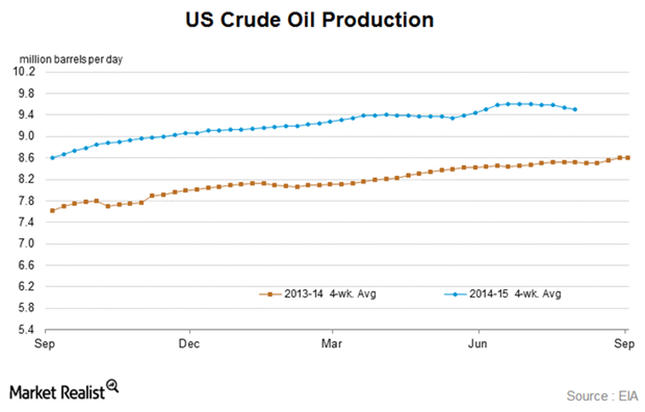
Fundamentals have not changed at all. U.S. oil production is still extremely high. The Energy Information Administration (EIA) reported that the week ending on July 31, oil production rose 52,000 barrels to 9.465 million barrels per day, which is a 12 percent increase from last year's corresponding time frame.

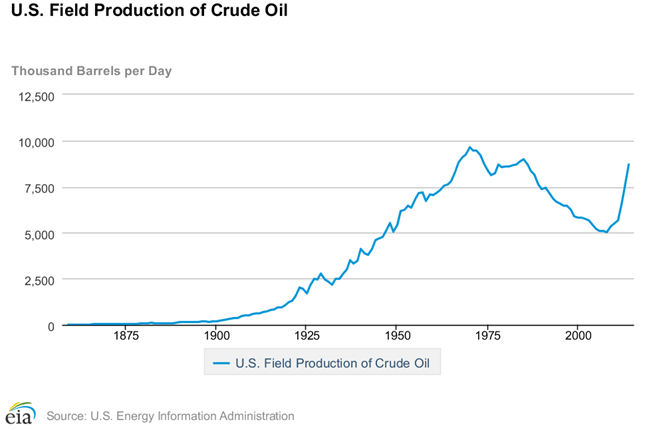
The Baker Hughes (NYSE:BHI) rig count has fallen tremendously from the 2014 highs, but a large portion of those rigs going offline were unproductive. The industry is operating with the lowest rig count since 2010, yet U.S. field production is the highest it has been since 1985.
In the past two weeks. rigs have been coming back online. Cash-strapped shale companies need all the revenue they can muster. Today, two barrels of crude need to be pumped just to equal the revenue of one barrel pumped back last November. The ongoing production is the only way the majority of these shale producers can stay afloat.
The U.S. shale industry is a bubble made possible by none other than the Federal Reserve. With their quasi-monetary policy experiment, the ultra-low rate policy, known as ZIRP, allowed shale companies to issue debt almost at will.
When the Fed announced their quantitative program for the thrice time in 2012, energy production in the U.S. exploded higher. Instead of going through the proper financing channels, these shale producers went into the high-yield market and issued debt, lots of it.
Nearly the whole industry's debt-to-EBITDA (pick your favorite metric) is atrocious. Around the turn of the year, when crude first shocked Wall Street, credit spreads gaped to over 1,000 bps, almost double high-yield market spread. The financial media pundits promised it was just noise. However, as crude begins to retest price support, spreads once again have widened to 1,000 bps.
It will get worse. The last act of desperation, oilfield service giants Schlumberger and Halliburton (NYSE:HAL) are looking for new revenue streams, and for some odd reason they want to take on the role of lenders ahead of a potential industry credit crunch.
As reported by Reuters, the two industry giants look to offer lending to cash-stricken companies and, essentially, take stake in wells. In some cases, up-front costs could be provided while well-performance is tied into repayment, or potentially lack-thereof. Make no mistake, what happen to gold producers following the retraction of gold prices will take place in the oil industry.
Companies will have to continue to slash operating expenses and deeper cuts in CAPEX could take place just to survive. Expect large integrated oil companies to devour assets as consolidation takes place.
On a market technician's viewpoint, if fundamentals do not shape up quick with support from consumption economies, like the U.S. and China, crude could break 2009's low of $33.20 per barrel.
I also expect the dollar to continue to rise, increasing deflationary pressure throughout 2016.
Price support is currently $42.02, just $2.22 per barrel less from where it is trading today. 2008's high of $147.27 per barrel creates a "V" shaped support and resistance price channel, which will likely hold prices.
If prices break through this key support level, selling could amplify if there is no catalyst to bring prices back north. A "demand" zone - an area where confirmed buying took place - between $38.34 and $34.04 will be the last line of defense for crude prices.
A close below this level, and a target of $27.14 per barrel is initiated.
