2013-2014: Not A Good Benchmark
It has not been difficult to find “as long as the Fed is in charge, we will never have another serious correction” comments in recent weeks. The July 31 selloff in risk assets may have brought some back closer to reality. Key points regarding the real world and investment stress:
- If you are relatively new to the investing world, you may not have a realistic reference point to understand how painful stock market corrections can be.
- A trip down memory lane of market corrections (1982-2014) reminds us of what a typical year in the stock market can look like.
- Is there any way to reduce stress related to the fear of a correction or bear market?
A Trip Down Correction Memory Lane
Since weekends offer an opportunity to study markets and improve our approach to investing, it may be helpful to take a quick refresher course on stock market corrections. We will focus on two questions:
- How far can stocks drop?
- How long can corrections last?
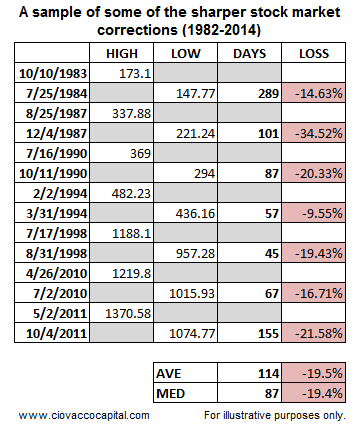
Sample of Corrections 1982-2014
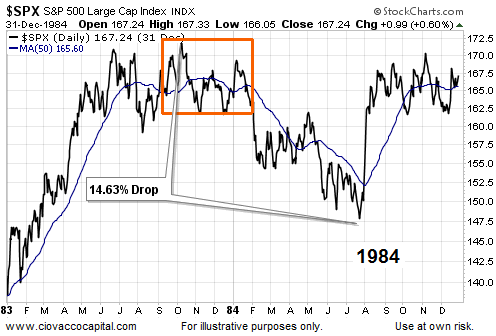
In 1984, stocks dropped 14.63%. Unlike the multiple-day pullbacks in 2013 and 2014, this correction lasted two hundred and eighty-eight calendar days (288).
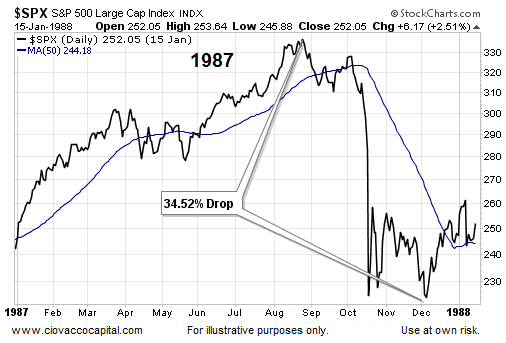
The 1987 stock market crash occurred within the context of a bull market, and the bull market resumed relatively quickly. Therefore, it is relevant to our correction study and 2014.
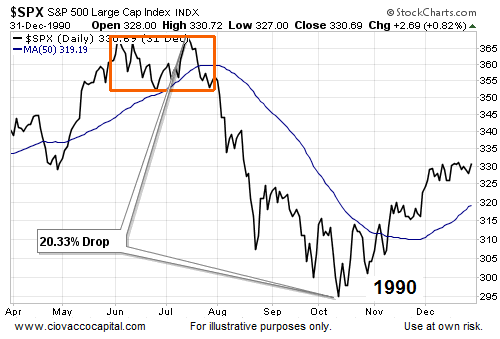
In 1990, stocks corrected sharply, dropping 20% over eighty-seven calendar days.
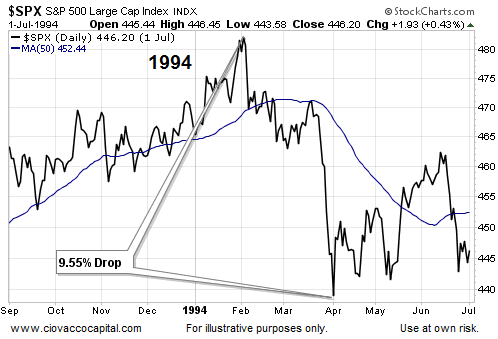
We have covered the importance of the investment landscape in 1994 numerous times, including this March 21 article. Stocks slid just under 10%.
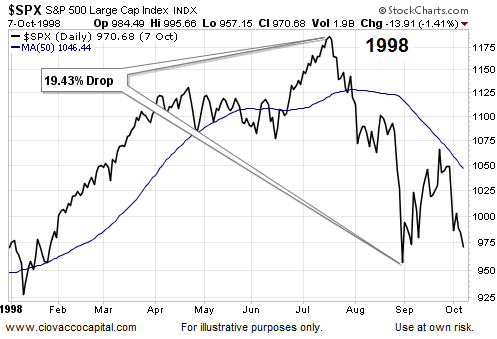
In 1998, the correction may have felt like a bear market based on the sharp declines witnessed on brokerage and 401k statements. The 1998 correction was outlined in more detail on April 2.
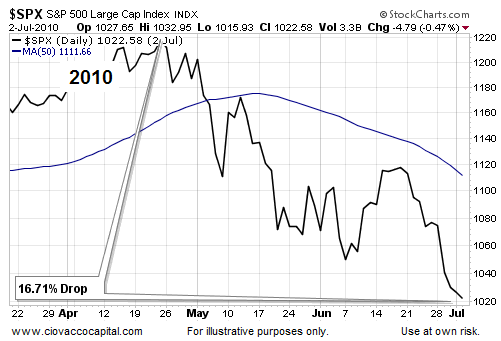
The 2010 Flash Crash was quite a bit more than a one-day media event. Stocks dropped 16.71% over sixty-seven calendar days.
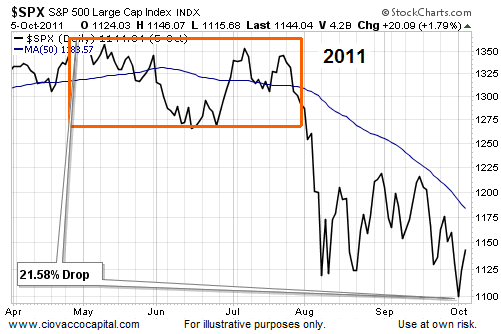
A political stalemate in Washington and escalating fears of the end of the euro, helped push stocks down over 21% in 2011.
2014: Numerous Concerns
If you know your market history, you probably remember the fundamental drivers behind the corrections in 1984, 1987, 1990, 1998, 2010, and 2011. The drivers in 2014 could come from a combination of concerns. From Bloomberg:
“Investors have been looking for an excuse to sell,” Angus Gluskie, who helps oversee more than $550 million at White Funds Management in Sydney, said by phone. “We’ve got a range of convenient reasons for investors to take some money off the table. The geopolitical risks have been rising and data flow in the U.S. is suggesting that the Fed may have to raise interest rates sooner rather than later. The Argentine issue is another piece of adverse news flow.”
Corrections Can Be Harmful To Your Portfolio’s Health
What are the answers to our questions of how far can stocks drop and how long can corrections last? Based on the examples presented above, the average loss was 19.50% and the average duration was 114 calendar days. Can corrections be less painful? Sure, there are countless examples of more shallow pullbacks. However, understanding what is possible helps with investment contingency planning.
Markets Are A Difficult Nut To Crack
Anyone who has worked on Wall Street or managed their own investments will have little trouble agreeing with the following statement:
The financial markets are a difficult place to succeed, even for those who have flourished in other areas of their life or career.
Therefore, there is no shame in having some missteps on your investment resume. Like anything in life, we cannot expect to see improvement unless we are willing to make some positive changes.
Stress Is A Call To Action
It does not matter whether you are a professional trader or someone who is investing for retirement; the odds are good you have some holes in your approach to the financial markets. Stress is nature’s way of helping us identify those holes. While there is no system or investment approach that can eliminate stress, there are things you can do to improve your odds of investment success, while greatly reducing stress related to bullish and bearish scenarios for both stocks and bonds. If you are tossing and turning at night, the first step toward sounder sleep is to leverage the simple and powerful concepts from David Schwartz’s book The Magic Of Thinking Big:
Stress Reduction Through Contingency Planning
What causes investment stress? The biggest contributor is uncertainty…How far could stocks drop?…What should I do?…When should I do it?…What happens if we see a 20% correction?…What happens if it morphs into a bear market and my stocks drop 50%?…How will I ever be able to retire?…Will I have to go back to work?
Stress Will Drop If You Can Handle Extreme Cases
When testing your current approach to the markets, it is helpful to look at extreme outcomes. If you can handle the extremes, then you can handle almost anything in between. Therefore, if the questions below induce a high level of stress and uneasiness, it may be time for you to provide some leadership for your portfolio. Do you have specific and implementable plans in place for the three scenarios below?
- Case A: stocks and bonds fall simultaneously as they did in 1994.
- Case B: stocks rise an additional 91% over the next three years as they did during the final leg of the dot-com bubble (1997-2000).
- Case C: stocks drop over 50% as they did in the 2000-2002 and 2007-2009 bear markets.
Two Paths To A Better Night’s Sleep
Individual investors have two “action cures fear” paths to take to improve their odds of investment success and worry less about the three market scenarios listed above:
- Path One: Build your own system to address the three extreme cases above.
- Path Two: Find an existing system or strategy that can handle all three cases.
The First Step Is Making A Decision To Take Action
Acknowledging the need for contingency plans and making a decision to do something about it will have a stress-reducing effect. A good next step is to set aside some quiet time when the markets are closed to outline a plan to move down one of the two paths above. If you want to build your own system. If you decide to get some help from an advisor or money manager, make sure their approach to the markets passes the “that makes sense to me” test. Even the best systems in the world experience frustrating periods that require patience. A manager’s system is useless if you cannot stay invested during bumpy periods. Compatibility of philosophy between you and your manager will make it much easier to stay within the confines of the disciplined approach.
Investment Implications – Contingency Plans In Action
Our contingency plans are governed by our market model. The model entered Friday’s session with a very large allocation to cash to offset the market’s increasingly vulnerable risk-reward profile. Are contingency plans helpful in the area of stress reduction? We think so. Our approach has called for recent reductions in portfolio risk - lower risk is highly correlated with better sleep. The first tweet is from July 25 and the second from July 31.


What prompted the risk-reduction chess moves on July 25 and July 31? Observable shifts in the market’s tolerance for risk. Here are three examples of recent 2014 evidence that said “risks are increasing from a probability perspective”; last Friday’s video outlined evidence of waning bullish conviction, a July 26 article showed a lower high that was forming on the weekly NYSE Composite chart and a July 30 piece showed evidence of concern on the ratio of stocks (SPY) relative to bonds (AGG).
While we are not fans of forecasting, the big picture in March 2014 is more in line with the increasing probability of a stock market correction, rather than a shift into a full-blown bear market. However, corrections can last several months and can do considerable damage to your portfolio and sleep cycle. Even if a corrective episode is averted in the short run, it is only a matter of time before the correction-less investment fantasy land comes to a painful end.
Stress-Reducing Plans vs. Stress-Inducing Plans
If your plan for investment success can be summed up with “I will figure it out as the investment landscape shifts over time”, your probability of success will be quite low. Traders have much shorter time horizons than investors, but they all have one thing in common; ad hoc and seat-of-the-pants traders are rarely successful. Professional traders who have a long history of producing above average results tend to spend much less time tossing and turning at night since:
- They have identified and understand what their edge is in the markets.
- They have risk management rules or systems in place to protect their hard-earned capital.
- They have backtested, but not curve-fitted, their approach to investing.
- They understand how markets price assets and their role within the bigger picture.
- They follow their systems and rules religiously. They do not rationalize away information from the markets.
- They have decided in advance how they will approach both favorable and unfavorable markets.
Further Weekend Study
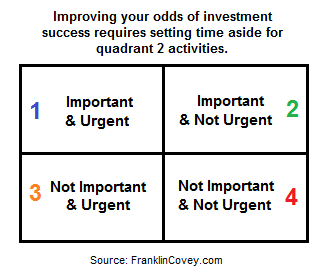
Contingency planning is a quadrant two activity – important, but not urgent. Many of you know the importance of getting into quadrant two from Stephen Covey’s book, The 7 Habits of Highly Effective People.
2014: Where Do We Go From Here?
Since this post was penned before the August 1 release of the monthly labor report, and before Friday’s trading session, it should be acknowledged that things are always subject to change, for better or worse. Entering Friday’s session, we were allocated in line with the evidence as of July 31. We have a good stake in cash, stocks (SPY), and a relatively small stake in Treasuries (TLT). If the evidence continues to deteriorate, we will continue to cut risk and possibly add defensive assets, such as a diversified basket of bonds (BND). If the evidence improves, we are open to redeploying our cash into growth-oriented assets, such as stocks (VTI).
