CPI hump day!
With the US dollar coming off (something we often look at in reverse when the USD is up and commodities are down), the inverse relationship meant that commodities were up. This is because USD-denominated metals become cheaper for non-US firms to buy and when half of the global demand for copper comes from China, this is a huge deal.
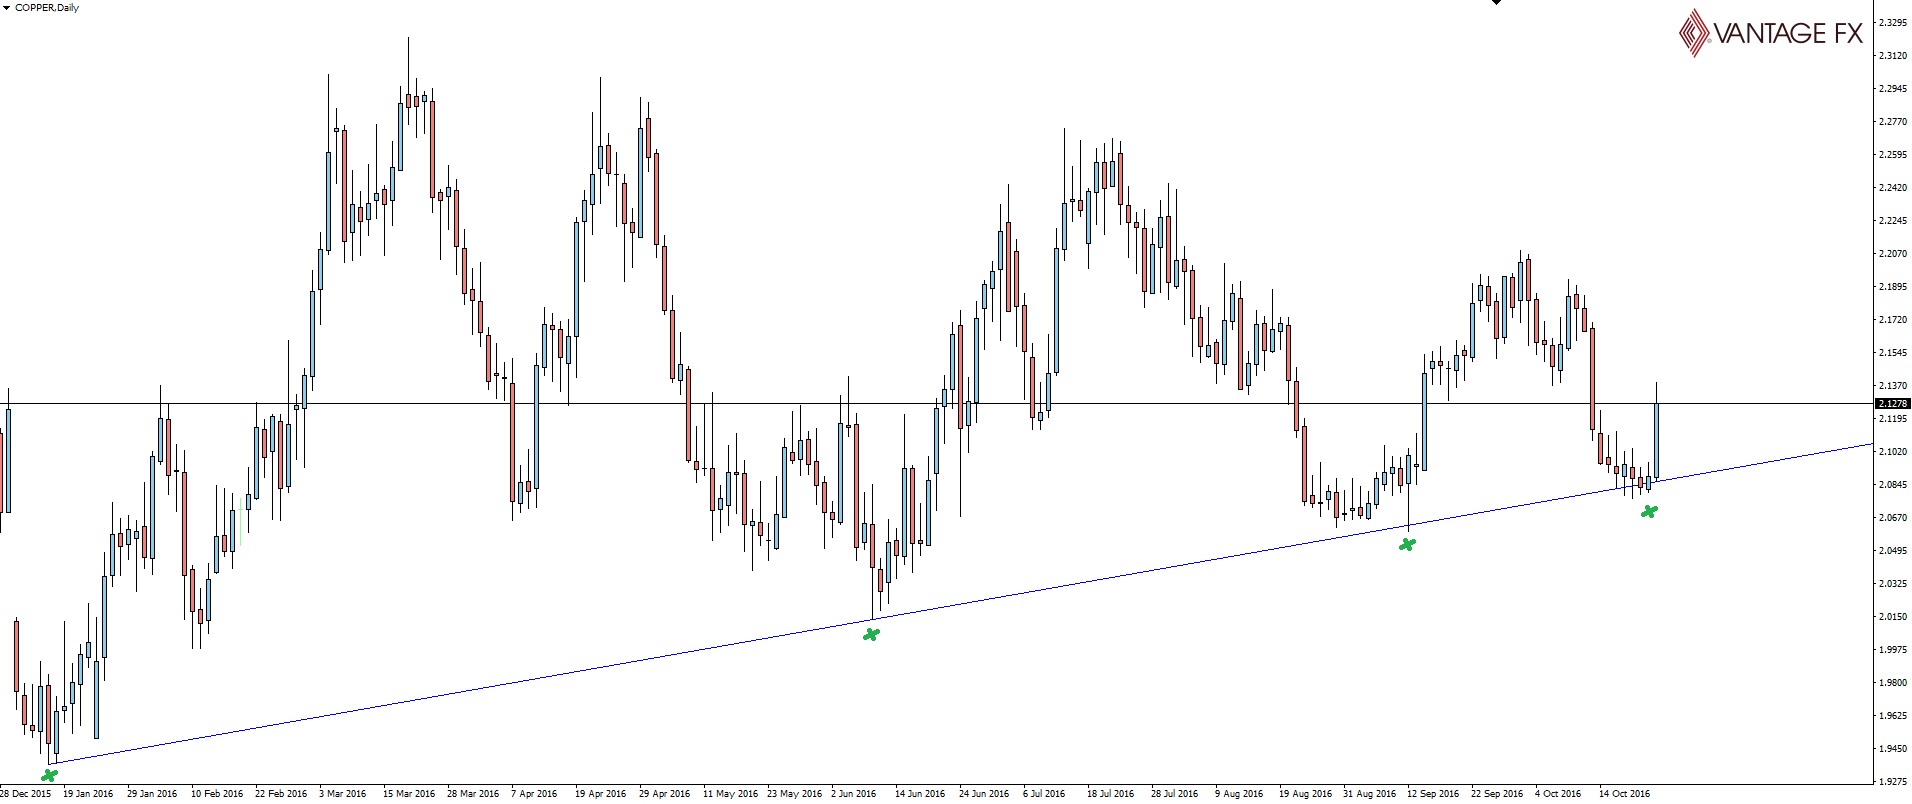
Taking a look at the copper chart, we see that this also coincides with a huge technical support level on the daily:
Copper Daily:
Time and time again. certain explanations are given for the reason certain assets rip, but can you argue with that support level?
No you can’t.
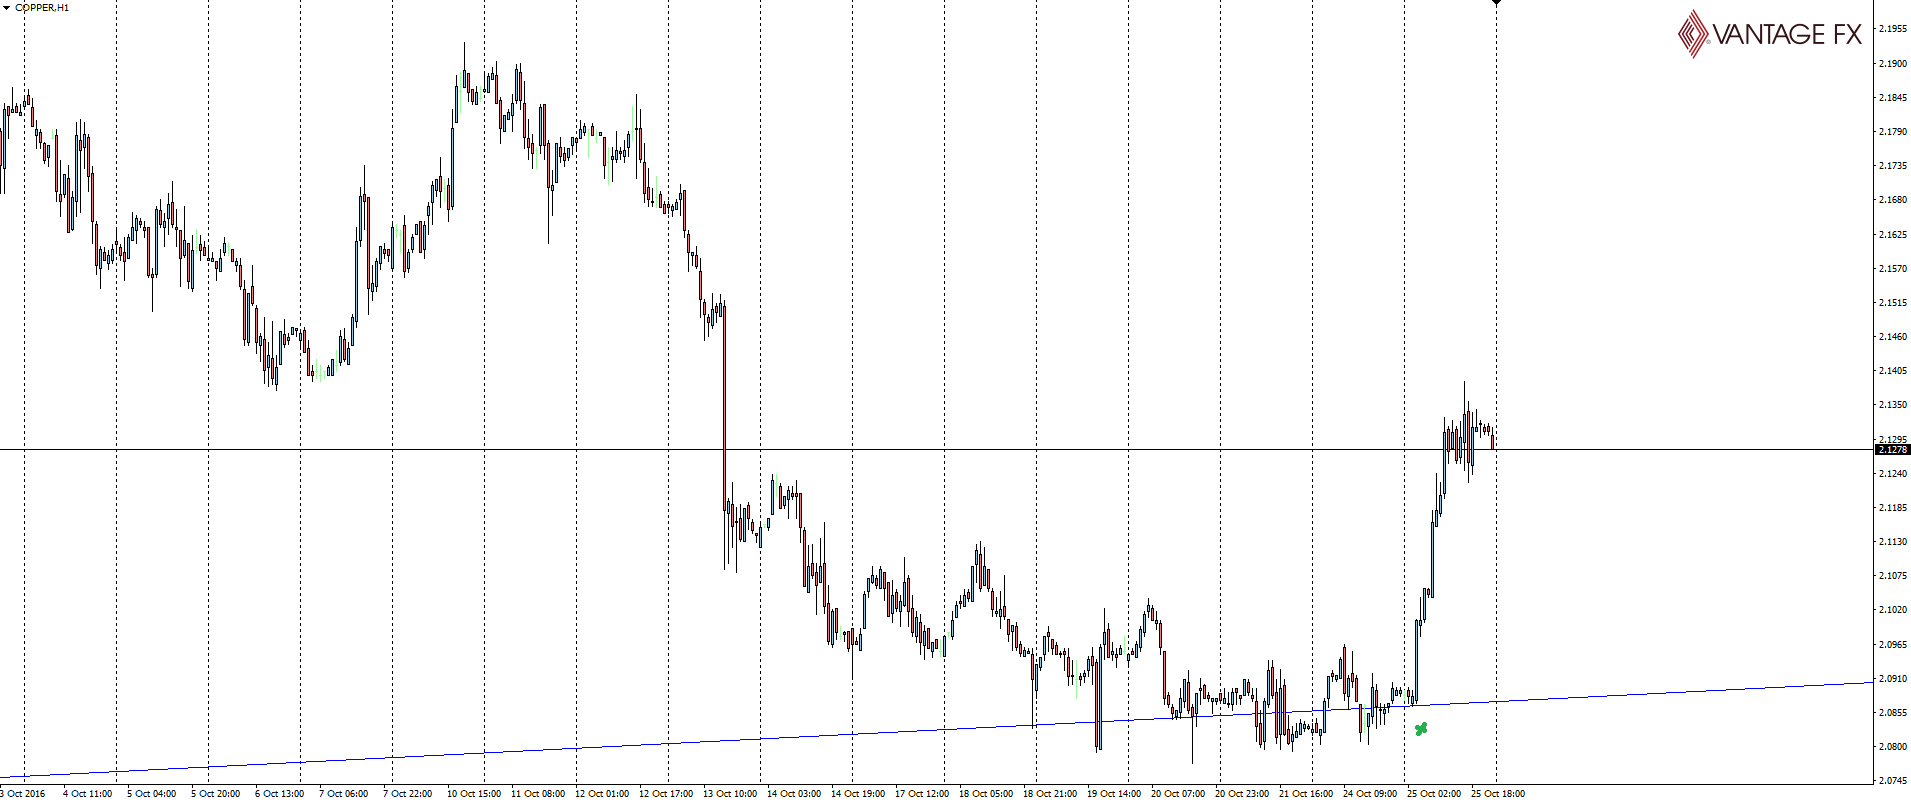
Copper Hourly:
Mark your major levels and trade your major levels.
But now looking forward, it will be the CPI number’s effect on the Aussie dollar that traders will be looking out for today.
AUD CPI q/q: 0.5% expected and 0.4% previous.
Just remember that consensus is now that the RBA is less likely to cut following the statement on the conduct of monetary policy by the Australian Treasurer and the Governor of the Reserve Bank.
For me, this is why a headline beat will more likely see the Aussie dollar rip higher at a faster rate than a miss would see the Aussie fall. When using data releases in your trading, it’s trying to read market expectations like this to identify where the biggest chance of a market re-pricing that is much more important than the number itself.
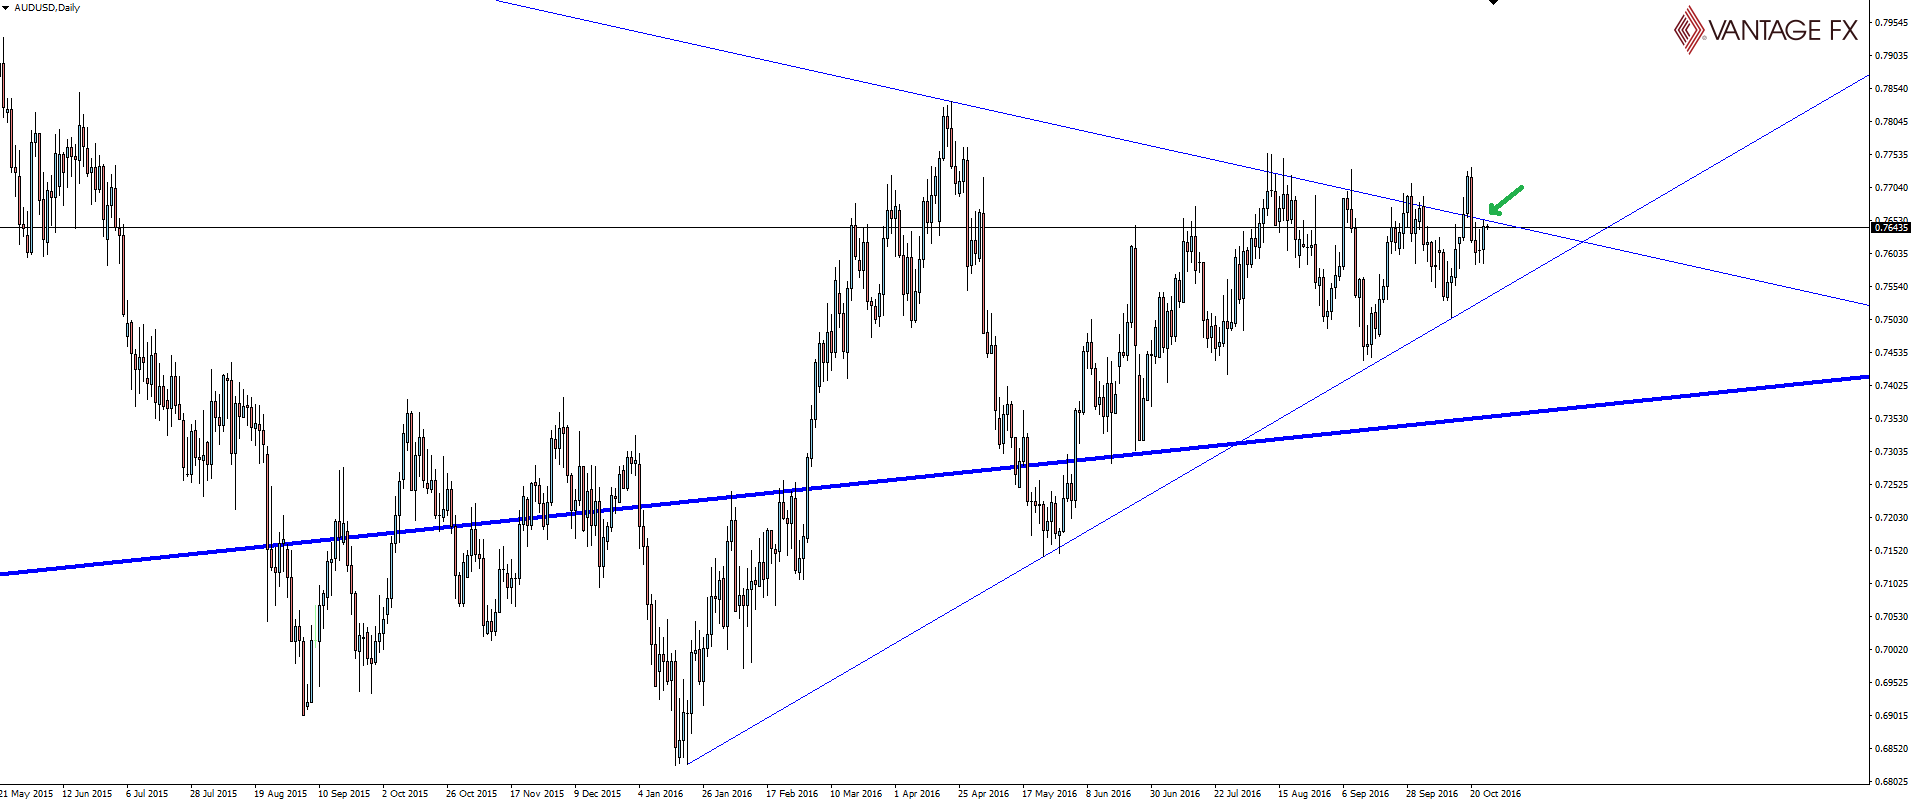
Moving onto the Aussie technicals and on Monday we were looking at the coil that AUD/USD was printing, waiting for the pop when it finally breaks out and possibly squeezes stops out of the market.
Well still we wait…
AUD/USD Daily:
Another daily candle and another tap of trend line resistance to the pip.
This level is boss!
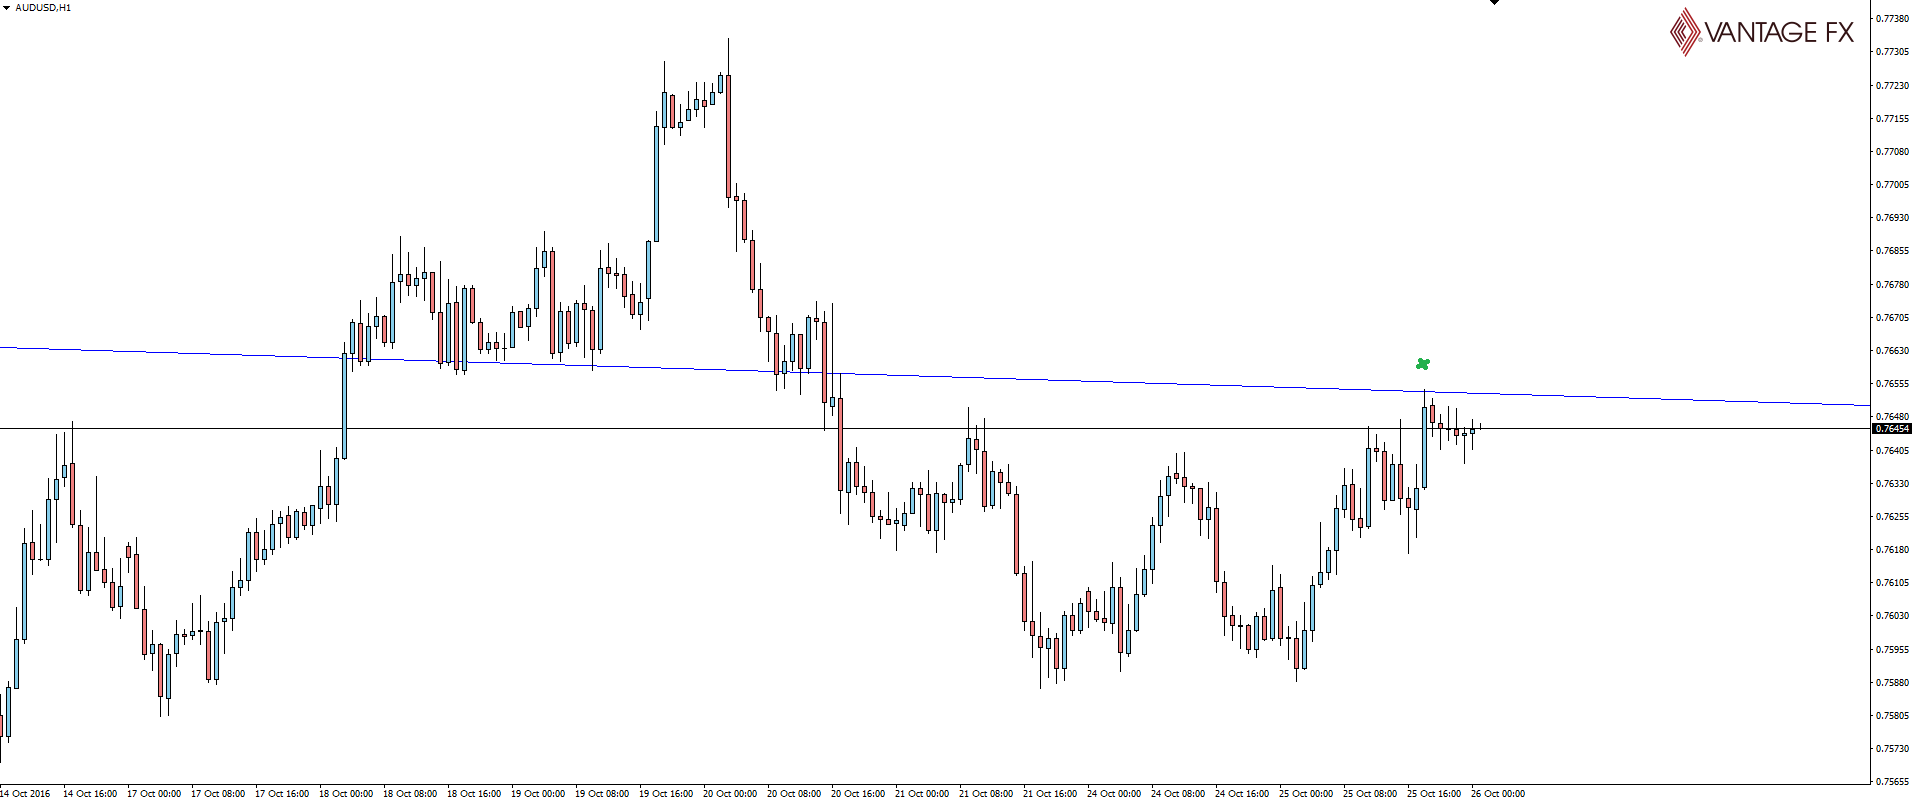
AUD/USD Hourly:
Zooming into the hourly and the level is shown in a different light. While you can see the short lived push above the level on the daily, this is the chart that shows how important the level is and where the smart money was lurking to take weak longs out of the market trying to get a jump on the breakout. Then where they added into their position on a re-activation of the trend line as resistance once again.
But the level HAS to go… doesn’t it?
Best of probabilities to you!
On the Calendar Wednesday:
AUD CPI q/q
Risk Disclosure: In addition to the website disclaimer below, the material on this page prepared by Forex broker Vantage FX Pty Ltd does not contain a record of our prices or solicitation to trade. All opinions, forex news, research, tools, prices or other information is provided as general market commentary and marketing communication – not as investment advice. Consequently, any person acting on it does so entirely at their own risk. The expert writers express their personal opinions and will not assume any responsibility whatsoever for the Forex account of the reader. We always aim for maximum accuracy and timeliness, and FX broker Vantage FX shall not be liable for any loss or damage, consequential or otherwise, which may arise from the use or reliance on this service and its content, inaccurate information or typos. No representation is being made that any results discussed within the report will be achieved, and past performance is not indicative of future performance.
