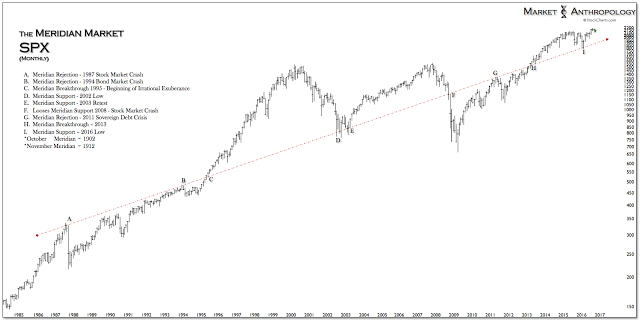
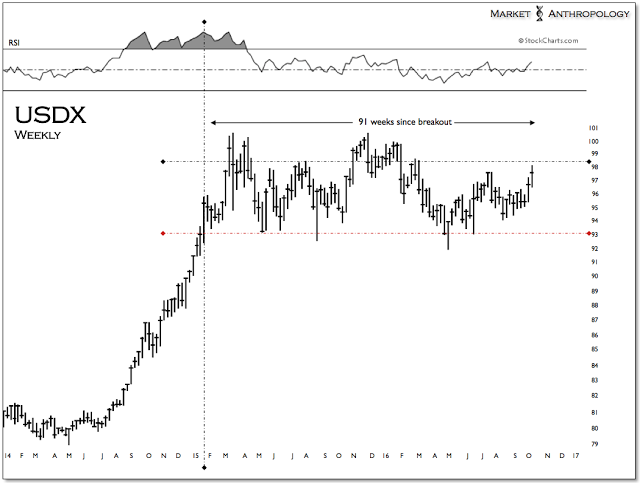
As markets often do, the dollar humbled our outlook to-date for a Q4 breakdown, tacking on another ~ 0.9 percent in the US dollar index this week and flirting with the highs from July.
Considering we’ve approached a prospective dollar breakdown as further motivation for maintaining a bullish bias in precious metals and those assets strongly influenced by a weaker dollar, lower real yields and rising inflation (e.g. oil and emerging market equities), we thought this week’s action in the dollar warranted a few follow-up thoughts on any tactical adjustments we've considered.
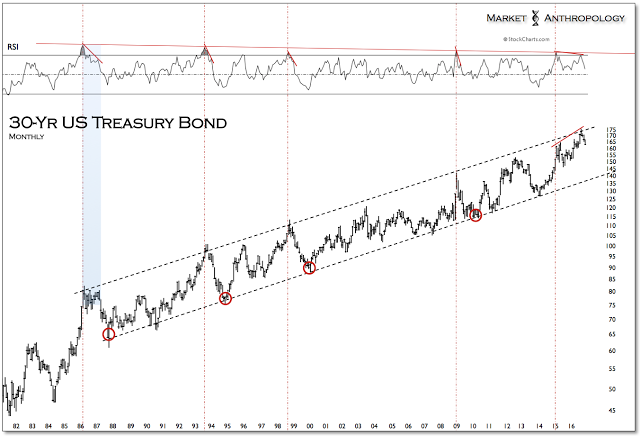
Moreover, taken in tandem with the ongoing weakness in long-term Treasuries that is also now flirting this week with a breakdown from the stoic uptrend that's extended since late December 2013, storm clouds have more than gathered on the markets horizon, which may portend a larger dislocation afoot.
That said, please forgive the stream of consciousness below that likely wrestles across too much terrain – and for lack of continuity is derived from many previous ideas and notes.
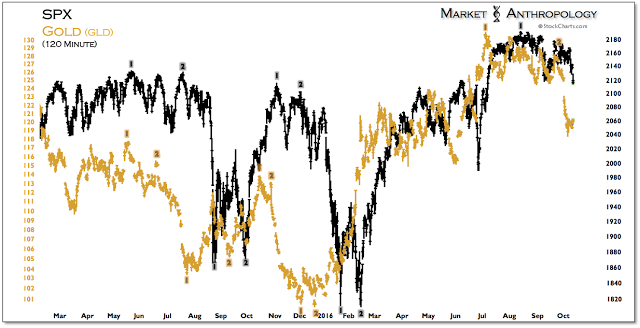
We've shown throughout the year that gold has not only led the broader reflationary trend, but pivots in the equity markets as well. Considering last weeks outsized decline in gold, a corresponding move is approaching in equities. Should the S&P 500 continue to follow the leading footprints of gold, another small retracement rally into next week would be followed by a more severe breakdown.
We are also watching oil to see if it continues to follow the dollar's lead, which would indicate another retracement move lower is on the horizon. 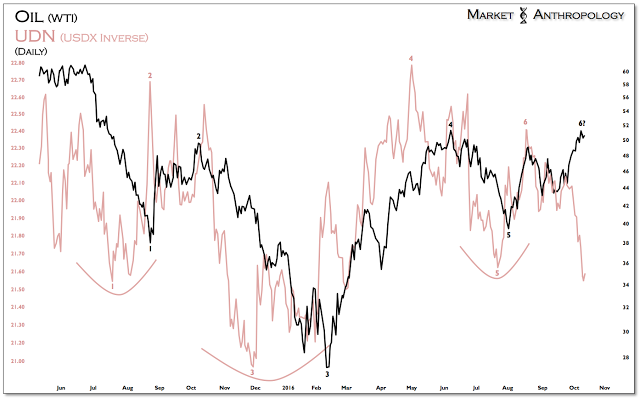
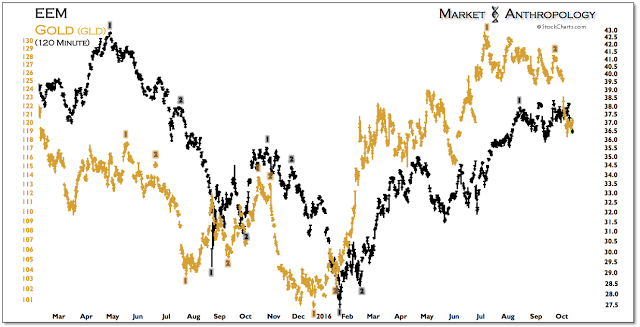
In the event that the decline in precious metals last week presages a larger dollar breakout or broader market squall, a short via EEM (iShares MSCI Emerging Markets ETF (NYSE:EEM)) may offer an asymmetric hedge to reflationary positions. We suspect EEM's outperformance this year would suffer in either a correction predominantly confined to stocks or a more pernicious environment characterized by rising yields and a stronger dollar that could negatively impact markets across asset classes. From our perspective, should precious metals resume their decline next week, it would lend greater probability towards the latter outcome in our opinion.
What has us concerned this week from an intermarket perspective, is a potential major breakdown in long-term Treasuries that could materialize with an equity market correction – i.e. risk parity be damned. And while we had looked for a breakdown in the Treasury market going into this summer that was setting up along the lines of the 1987 bond rout, long-term Treasuries broke out to new highs as the Brexit vote in the UK roiled global markets and pushed back a prospective rate hike by the Fed.
With those expectations once again coming to roost as we approach the end of the year and the two final Fed meetings, Treasuries will need to find a quick bid to stave off a technical break that is potentially leading the move in stocks. 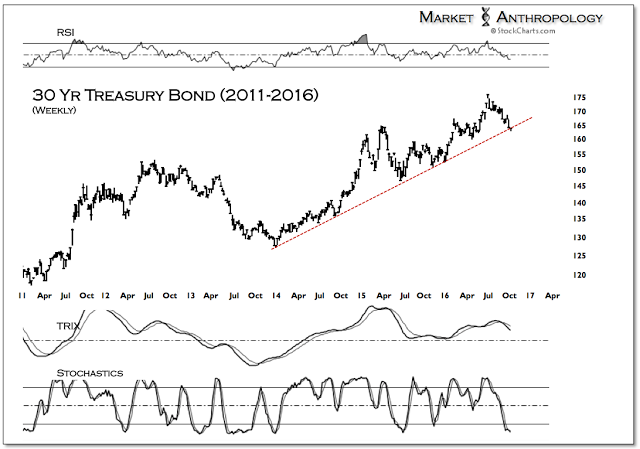
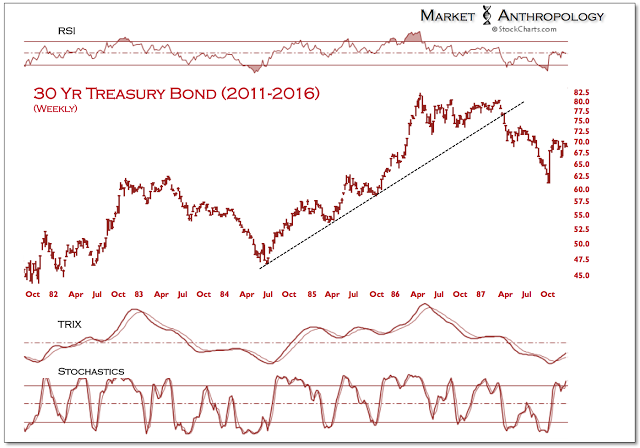
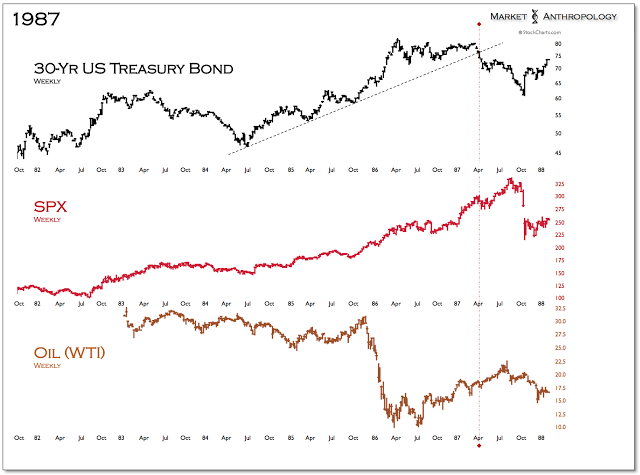
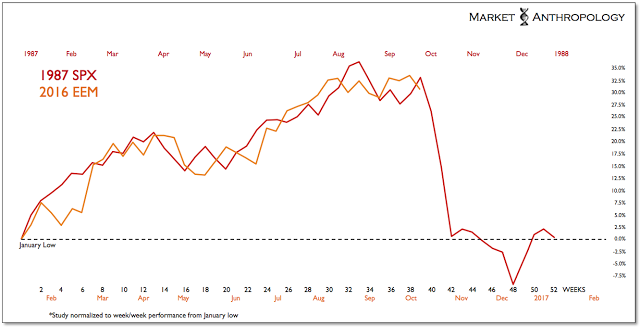
Generally speaking, the 1987 market was characterized by a large reflationary move higher in equities and commodities, with the bond market breaking down some six months before equities crashed that fall.
This year, asset classes have trended much closer together than in 1987, which presents potentially greater negative feedback risks, in the event that both stocks and bonds overlap corrections with a restrengthening US dollar. From our perspective, if the dollar breaks lower again it would greatly mitigate that risk, as a weaker dollar could smooth and diversify performances across asset classes, rather than further magnify a negative feedback loop in the markets. 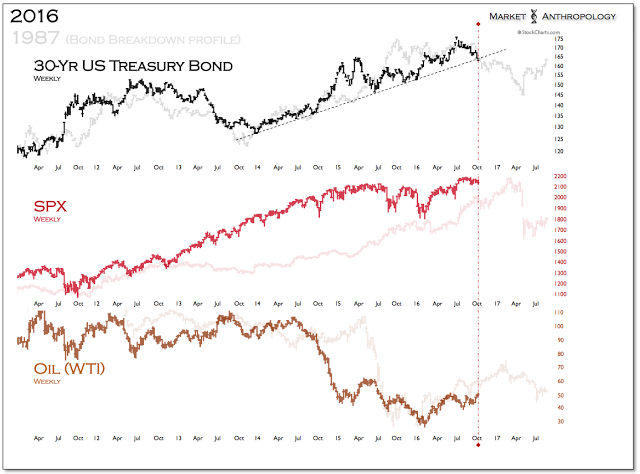
Although a market crash like 1987 is an excessively low-probability outlier event, the reflection piqued our interest from a more variant perspective. Despite it's lurid place in the annals of market history, the 1987 stock market crash also proved to be an excellent buying opportunity.
In the past (2011 S&P 500 see here and 2014 Nikkei see here) we have used the 87' performance and momentum profile of the S&P 500 to also project the less mentioned, but as important and subsequent bullish recovery over the following years.
As such, we asked ourselves if today's outperformance in emerging market stocks gave back 30 percent between now and the end of the year, do you think traders and investors would still have the appetite to buy them? All things considered, and similar to participants behavior in the wake of 1987 – not likely.
And as improbable as the potential outcome may be, there are some performance similarities between the moves in the S&P 500 in 1987 and emerging market stocks today that both benefited disproportionately from the respective broad-based reflationary trends.
Until the intermarket tea leaves are better revealed to us, we like the prospective hedge of a short position in EEM over the coming weeks. And should history repeat, we would also like to buy it back in spades next year.
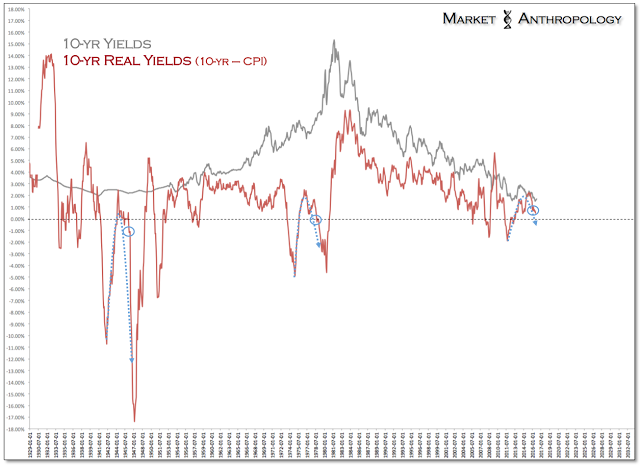
Despite carrying some heightened concerns in the currency and bond markets over the coming weeks, we still believe that both the US dollar and US real yields are in the process of turning down again and testing their respective cycle lows from 2011. These market dynamics are similar to how the two previous long-term real yield cycles culminated in the late 1940's and 1970's, that slowly rolled over and tested the bottom of the range, as inflation surprised with much greater reach than nominal yields.
We've described in previous notes the parallels with the 1940's and today, that range from the extraordinary support extended by the Fed and Treasury to the financial markets and the likeness in disposition of the long-term (nominal) yield and equity valuation (CAPE) cycles.
Ultimately, as real yields waxed and waned between disinflationary/deflationary and inflationary market environments, it engendered varying bull and bear market cycles within equities and commodities, with the current market environment still most resembling the cyclical peak in equities in 1946.
While the 1970's are largely characterized as an inflationary and rising rate environment, when normalized through the prism of real yields, the similarities with today in varying equity and commodity market cycles is also apparent.
What's interesting to note is that the current uptrend in gold that led the broader reflationary trend last December, echoes the resumption of gold's uptrend in the late 1970's that began as the dollar rolled over with real yields and tested the long-term cycle lows. While gold's performance this year is not as exceptional as the 1976-1977 rally, the structure and momentum profiles are similar.
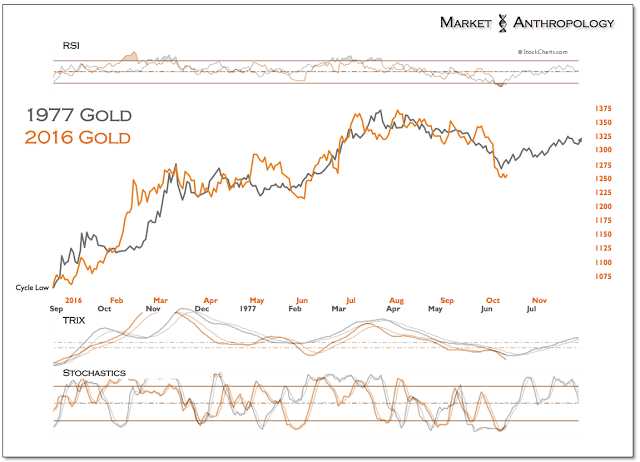
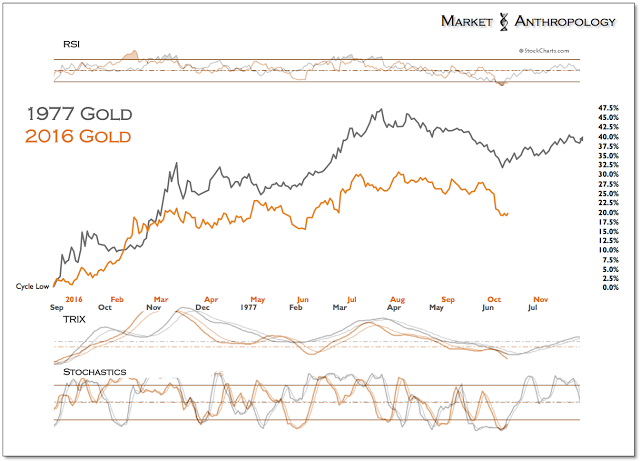
Like today, the resumption of the bull market in gold was motivated by a downturn in the dollar, which again gained greater momentum in the back half of 1977 as the over two-year broad top in the dollar broke down.
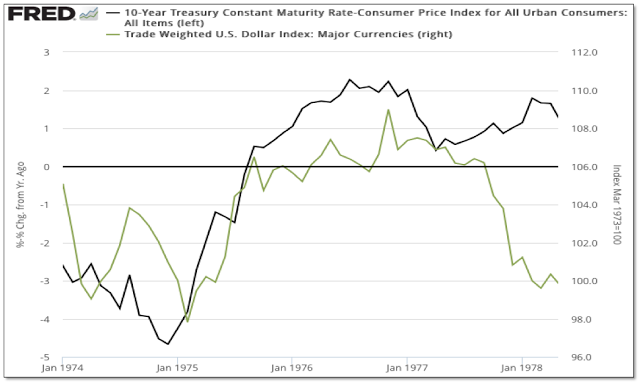
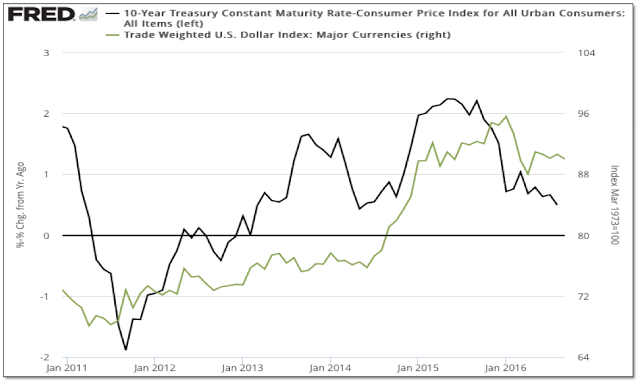
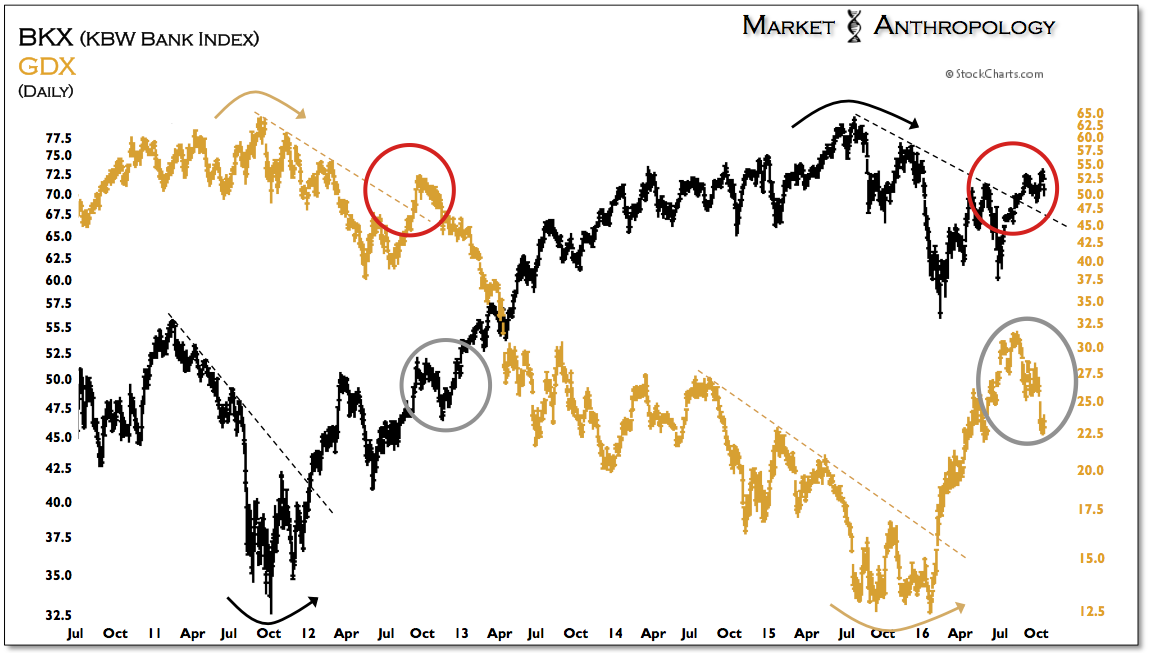
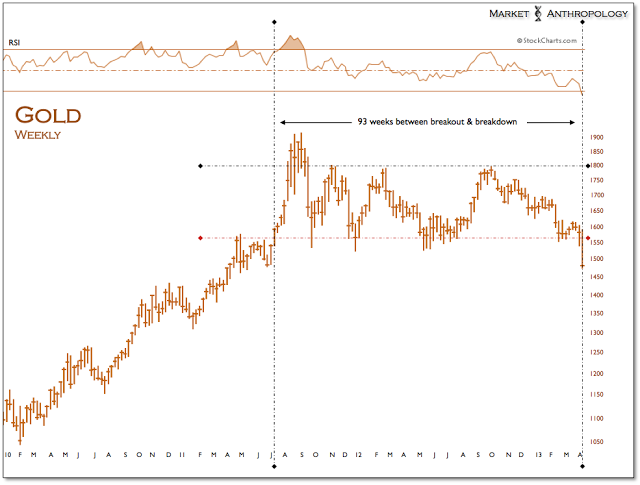
And although the current dollar bull was more than five times as large as the mid-seventies move, the broad top corresponds with today, that now in its 91st week also resonates with the flip-side of the cycle and gold's broad top carved between 2011 and 2013. This also dovetails into the inverse performance dynamics we've followed between the banks and gold miners this year.
As a postscript aside, we read an interesting piece last week in the Wall Street Journal (see here) that resonated with our observations of Shiller’s CAPE ratio, if not from a simple pattern perspective. Basically, the Journal reconstructed CAPE to normalize a more consistent earnings measure, which as they described, was disproportionately influenced by severely depressed bank and business earnings during the financial crisis that had since inflated valuations.
Because Shiller’s CAPE utilizes generally accepted accounting principles, or GAAP – and that these principles have been revised on multiple occasions over the past three decades, they looked for a more consistent measure by using the Commerce Department’s quarterly data on total U.S. after-tax corporate profits and the Fed’s data on the total value of US stocks, rather than the S&P 500.
What they found was, “From the early 1960’s through 2008, the two CAPE measures moved nearly lockstep with one another. It is only after the financial crisis that the two measures diverge, with the corporate-profits CAPE rising much more slowly than Mr. Shiller’s measure does.” 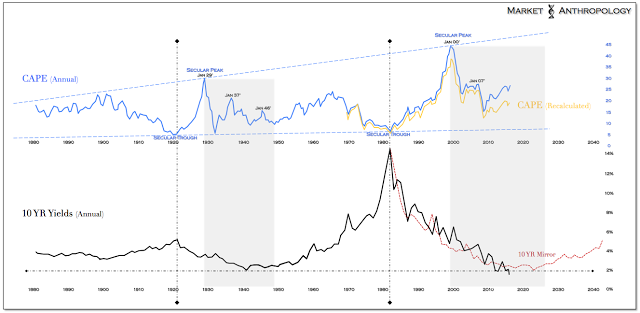
Despite our reluctance to share the same bullish suggestion of the title that, "A close look at a Nobel Prize winner’s valuation metric shows that the market isn’t as highly valued as it appears”, the reconstructed ratio does resonate with our comparative observations of the 1930’s and 1940’s, which saw diminishing valuation peaks from the 1929 secular high. And although we’ve approached the CAPE high from 2007 as more or less a valuation “ceiling” of the current cycle, it did seem out of place that equities even reached the ceiling in this cycle.
Perhaps as the WSJ suggests, the market isn’t as highly valued as it appears, but that certainly doesn’t make US equities a buy today from a historical perspective. A quick look back at the late 1940’s and the equity markets stumble across the transitional divide to the next growth cycle is a good place to start.
Moreover, from a proportional perspective of the long-term yield cycle, which we’ve argued directly influences a dynamic and expanded range of CAPE, the potential stumble across the current transitional divide may last considerably longer than the last. That said, should the equity markets swiftly revalue as they did in 1946, we would again be selective buyers of emerging market equities, as we'd expect their outperformance to resume in a weak dollar and declining real yield market environment. 