Following a mild winter whose bite never lasted longer than an occasional weekend squall, the lingering late frosts of April finally gave way to the warm breezes of a reluctant spring. For those of us who find bearings from the touchstones of the seasons: the pungent whiff of ozone, the clean crisp air of fall; the early daffodils – the receptive muddling leaves a strange and unfamiliar feeling. What month is it again? Did I change the oil in the tractor, yet? Why aren't the Yankees on TV...
With the Dow tagging 18000 for the first time since last July and the S&P 500 now flirting around 2100, it appears that more than the weather has changed for the better. Will it last – remains the hanging question. Like the weather whose seasonal transgressions occasionally bewilders, but ultimately is beholden by our position from the sun, we expect US equities will again be capped by the cycle whose own arc at times has appeared to wobble on its axis.
Since beginning the year deep in the red, both equity indexes have rallied sharply since mid February, erasing losses that had quickly fallen by more than 10 percent on the year. Accompanying and actually leading US equities in this reflationary move has been markets and sectors that in the past had heavily underperformed. Namely, precious metals, emerging markets, oil and energy companies and commodities and commodity producers – that collectively have enjoyed their largest rally in over 5 years. What they all have in common is a valuation sensitivity weighed against the broad counterweight of the US dollar, whose best days – as we’ve speculated, were in its past.
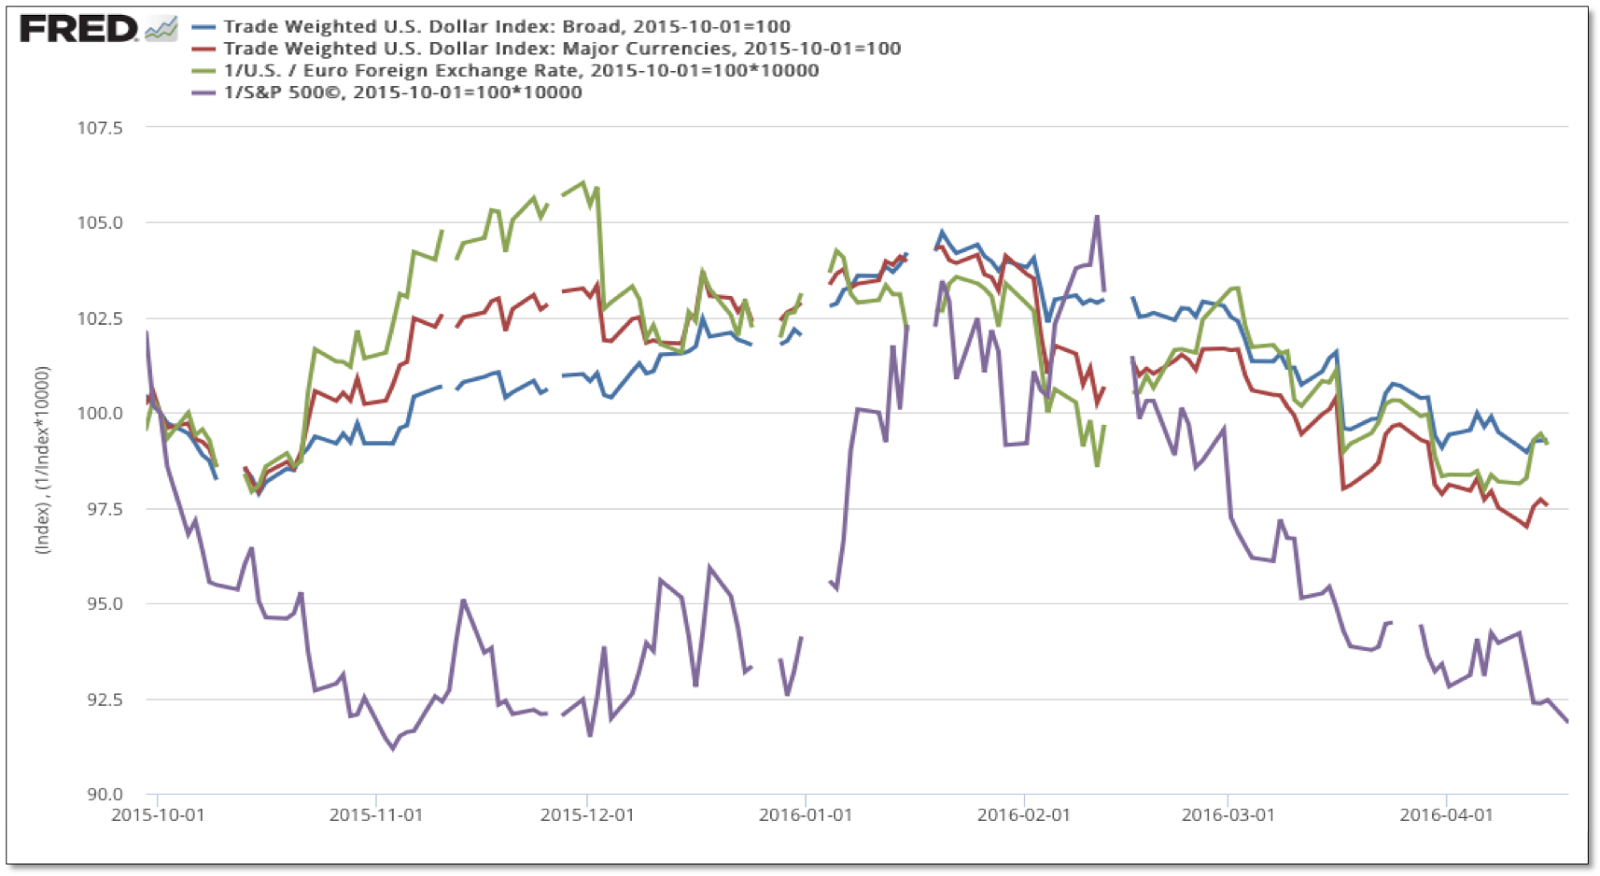
Will the dollar continue to trend down and will it be enough to sustain a broader move in equities above their respective highs – is the follow up question for investors and traders alike. Over the near-term, the major benchmarks for the dollar continue to flirt with the lows from last fall; a spot we have speculated would provide support for a retracement bounce. Considering the strengthening inverse correlation that equities and the dollar have trended with since that time, the S&P 500 is now bumping up against its highs from last fall as well. Although the bounce in the dollar may move first, we do not believe the rally in equities is sustainable or represents a major breakout from the range the markets have remained within over the past 2 years.
A weaker dollar has been increasingly viewed as a welcomed condition for the economy and for the markets, following a long span of tighter financial conditions – discretely sustained through a much stronger US dollar and rising real yields. Despite hiking the fed funds rate a quarter percentage point in December, financial conditions have actually loosened as nominal yields fell but inflation expectations have firmed. This is the opposite dynamic of the taper tantrum in 2013 where real yields spiked as inflation continued to soften and nominal yields rose sharply. Commensurately, the commodity markets have benefited this year from this macro shift; one we expect over the long-term will continue to tilt the balance in favor of hard assets versus equities.
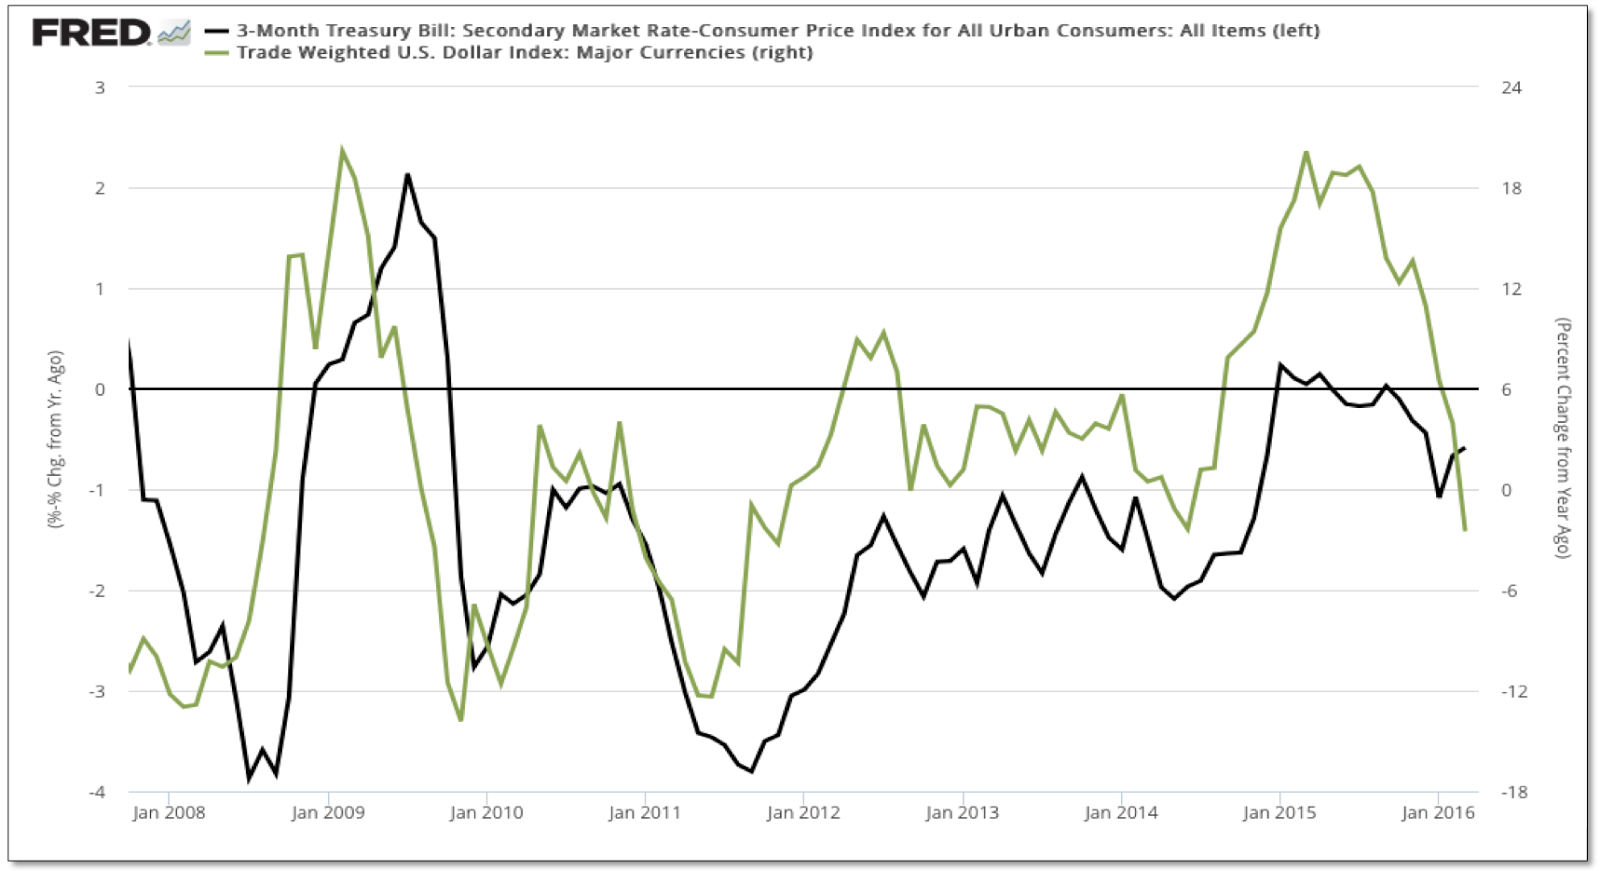
Looking back at the cycle for perspective, real yields began to rise shortly after the US dollar and short-term yields troughed in 2011 and began their ascent over the next several years. As the dollar strengthened with short-term yields, assets like gold and commodities became highly unattractive as inflation turned down and shorter-term yields rose. This critical differential created a virtuous market environment that strongly favored equities, as disinflation is generally a welcomed condition for stocks by boosting growth and price/earning multiples and kryptonite for commodities as investors chase securities with actual yields.
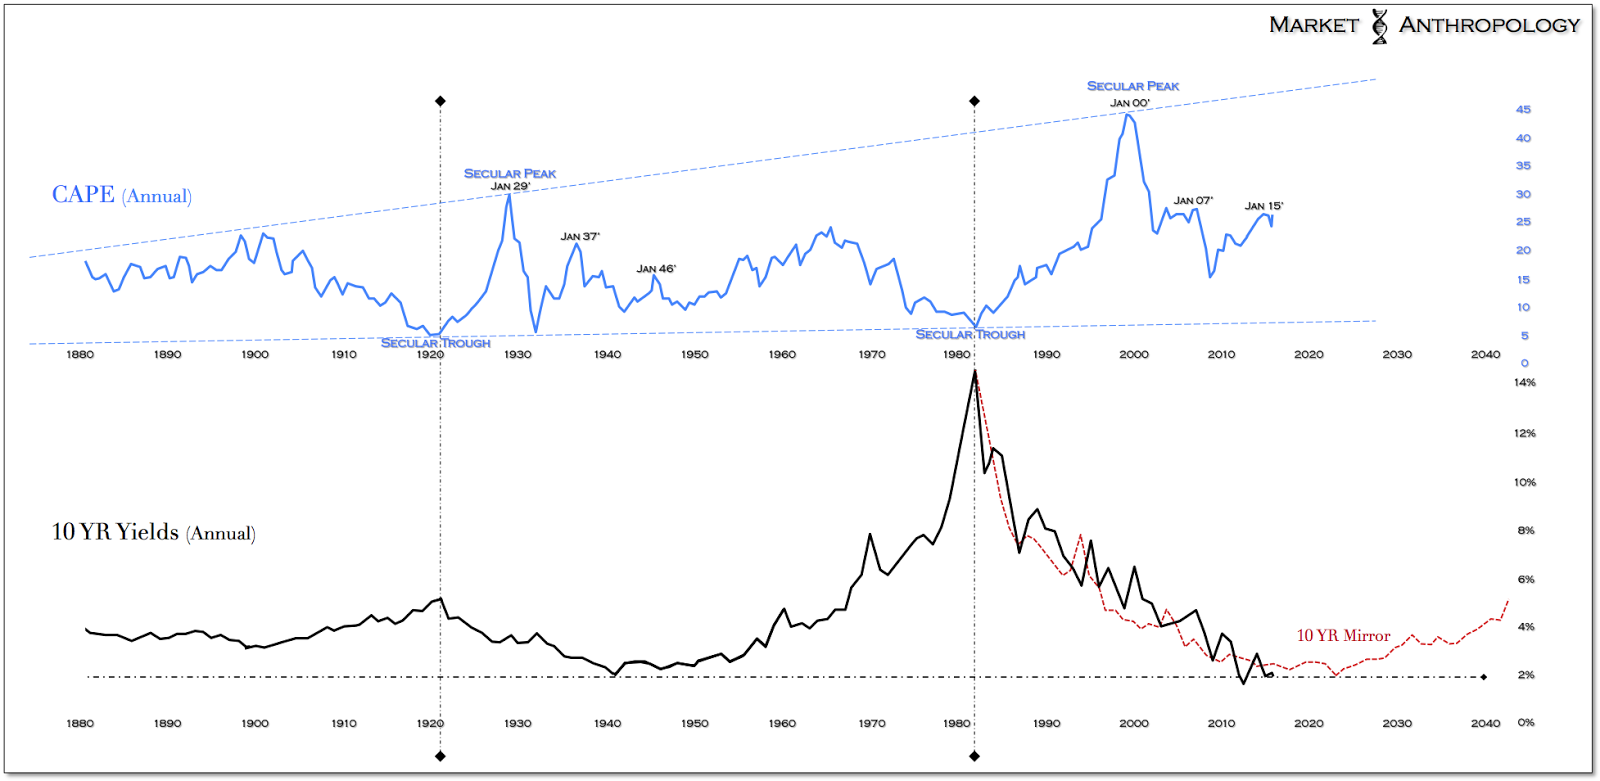
Although the cyclical rise in the dollar culminated with a push to a relative performance extreme last year, the notion by some that the buck is under a more secular persuasion flies in the face of the long-term yield cycle, which continues to follow a relative proportional retracement decline that would indicate a lower for longer market environment - perhaps much longer than most would suspect. It remains our suspicion that until the next secular growth cycle commences and yields begin a more perennial rise, the dollar will continue to follow yields' lead (from 2014) and back into the trough of its own long-term cycle. This general market perspective in which yields lead currency moves – which lead equities, impressions us to suspect that a secular breakout move for equities is still far out on the horizon and that returns for long-term equity investors will likely be subpar for the foreseeable future.
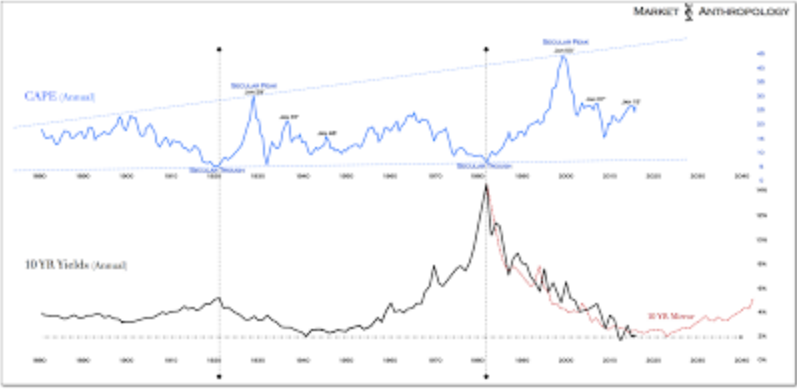
While a rise in inflation expectations should be a net positive for the economy over the next phase, the end of the Fed’s virtuous disinflationary cycle that helped push equity valuations up to the ceiling of the last (i.e. CAPE) - will likely not be as benevolent to equities over the long term as another pulse of inflation works through the system. All things considered, this has already been the case, as stocks have gone relatively nowhere since the end of quantitative easing and will likely not benefit collectively as monetary policy becomes even less certain and as the Fed’s willingness to intervene with major policy initiatives continues to diminish from their crisis stance.
Although the relationship between stocks and inflation is nuanced and dynamic at different points in the cycle, the sweet spot (i.e. disinflation) in which equities became overwhelmingly attractive to investors and hence, richly valued – is likely over. While the broad-based reflationary trend out of the February lows has lifted all boats to-date, we suspect the anticipated bounce in the dollar over the short-term will cap the move. Looking out a few months, it’s hard to imagine a market environment – either one in which the dollar takes out the highs and resumes its uptrend (unlikely) or where gathering inflation expectations rekindles more hawkish posturing (more likely) – where equities outperform. Currently, we view the markets in limbo between these respective outlier outcomes and fears, where the benefits of inaction by the Fed has allowed a more correlated return on the back of a weaker dollar.
- Postscripts
Despite treading water through much of April, over the near-term we view the dollar as the main instigator in the markets and still see upside risks outweighing a continuation lower. As such, we are looking for the stall in gold that has extended into its second month of churn, to eventually resolve down and complete its retracement decline.
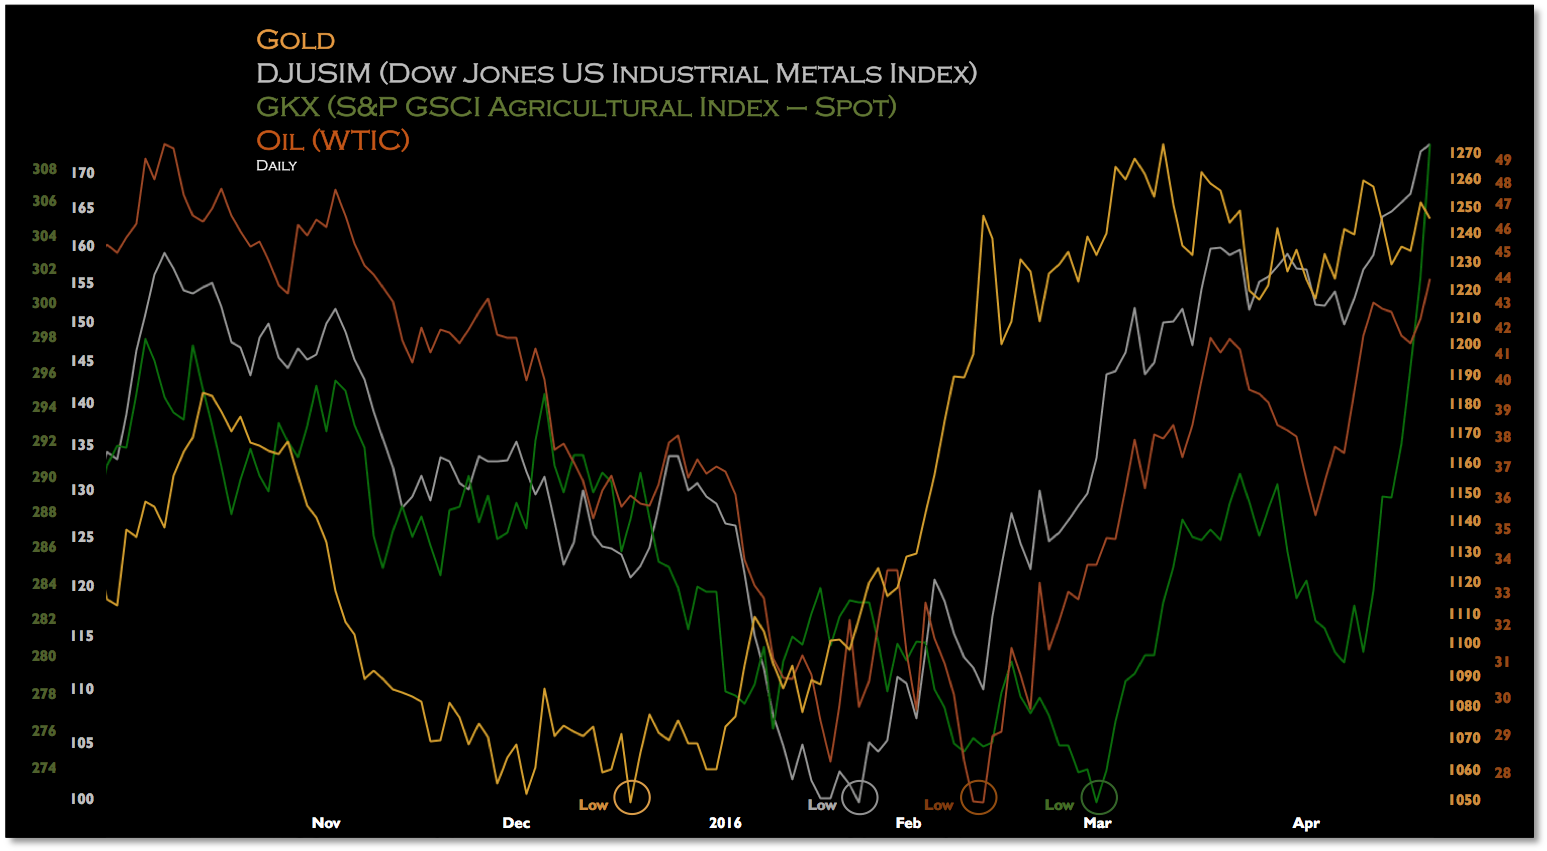
Just this past week, industrial metals - led by the cusp asset of silver, caught up with gold's leading move and broke above its highs from last year. While we remain bullish over the long-term, similar to the subsequent consolidation in gold since March, we suspect silver will consolidate lower with the broader commodity complex as the dollar's retracement rally runs its course.
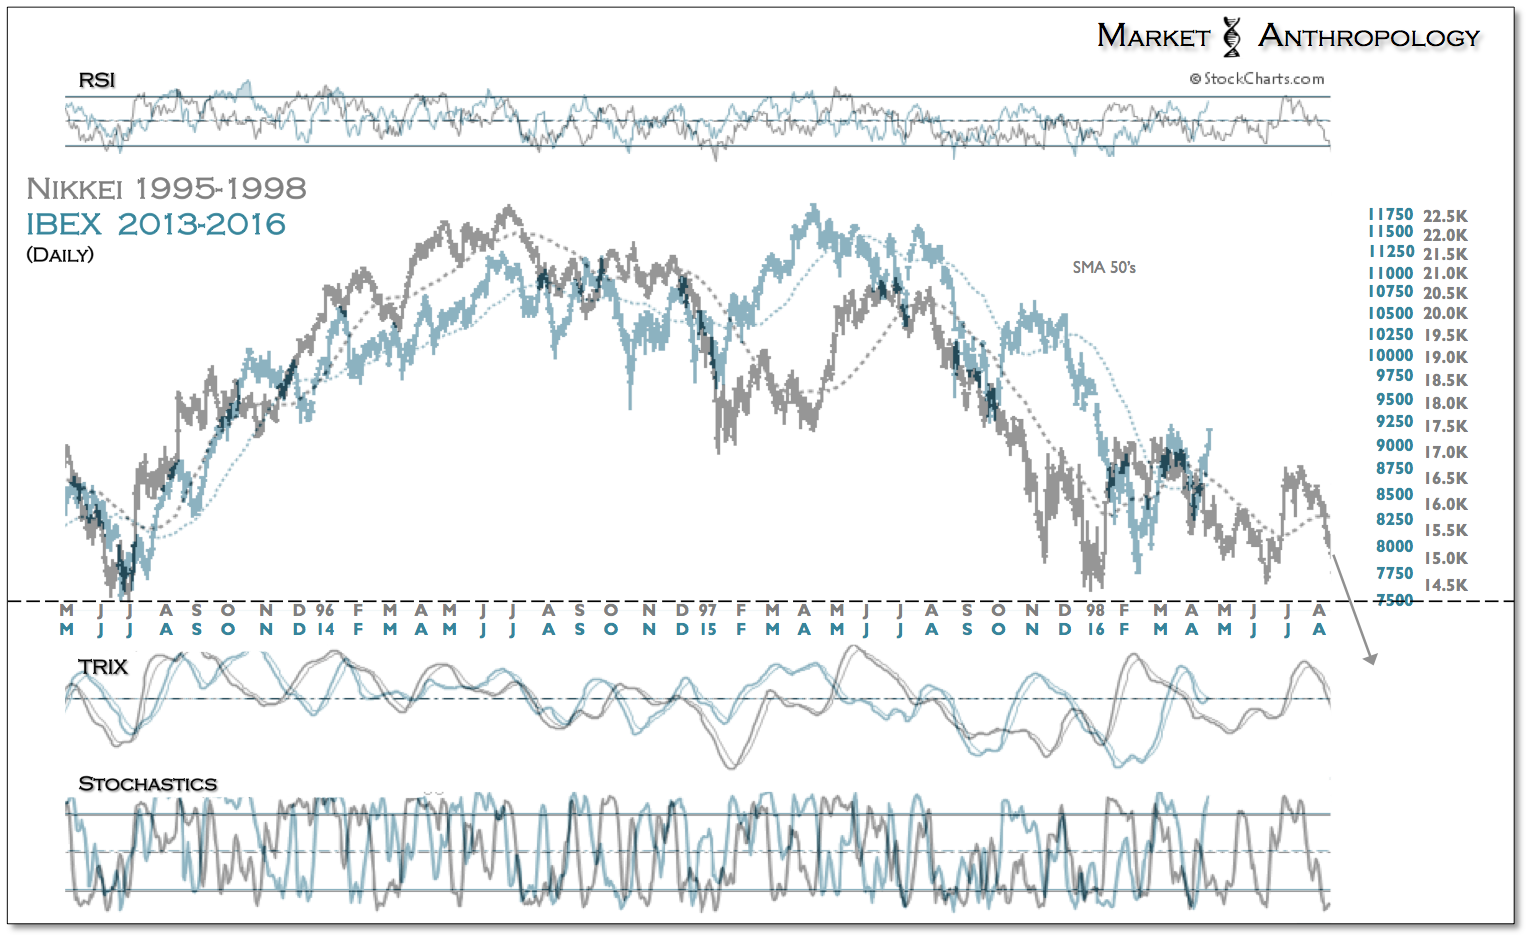
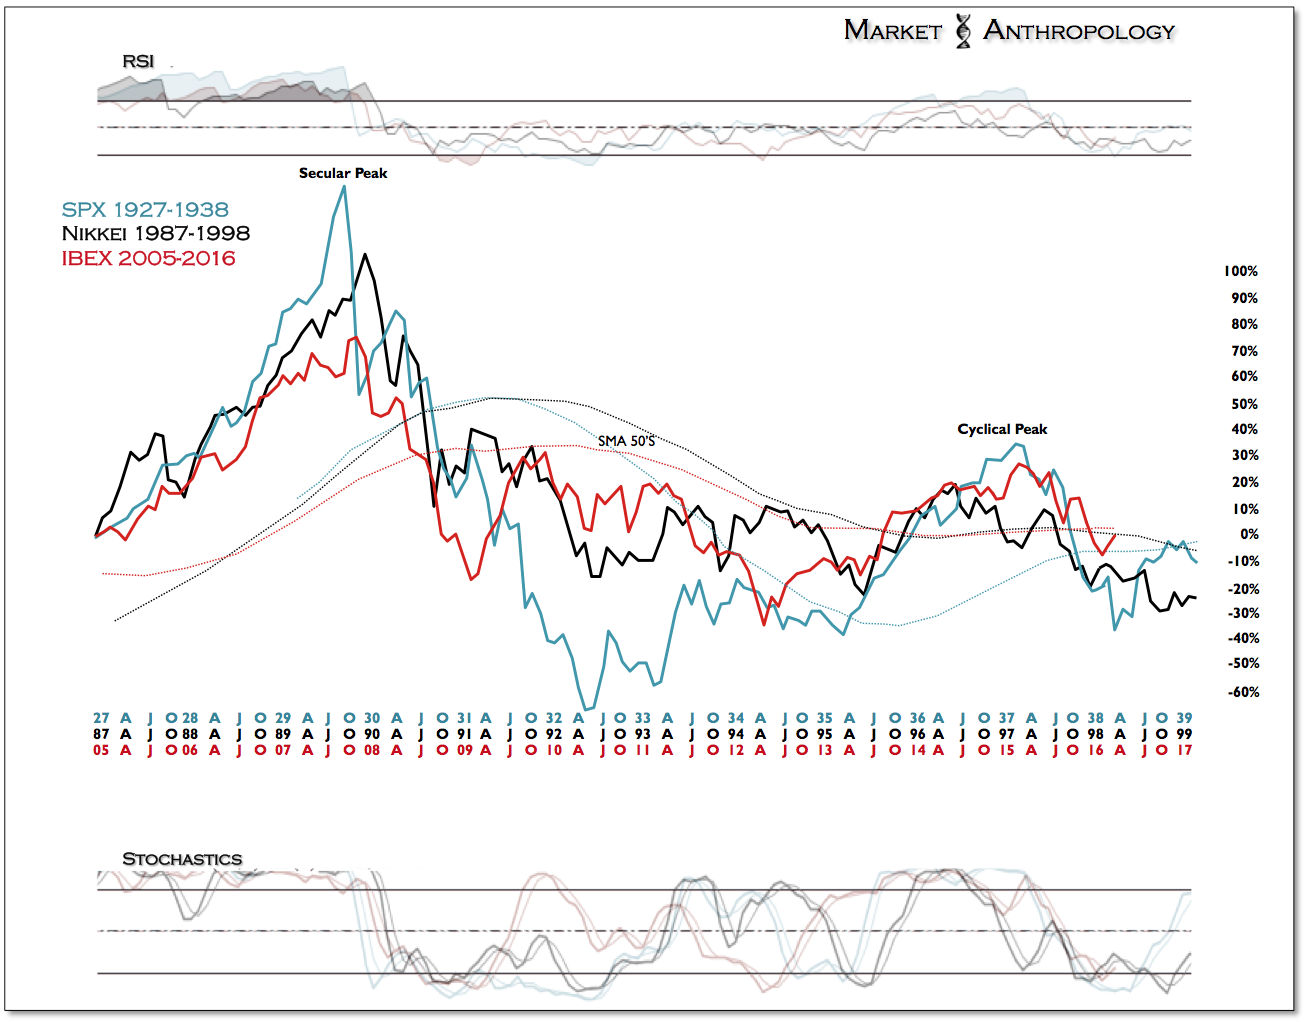
From a comparative perspective, our IBEX/Nikkei series that we've followed over the past two years for good reads on momentum in perennial asset declines, is now trading at a level we expected the retracement rally to exhaust. And while the IBEX is a higher beta index to US markets, a correlated pivot with other developed markets worldwide appears more likely than not. That said, should the IBEX continue to rally from here, we would approach it as a bullish proxy overall towards equities.
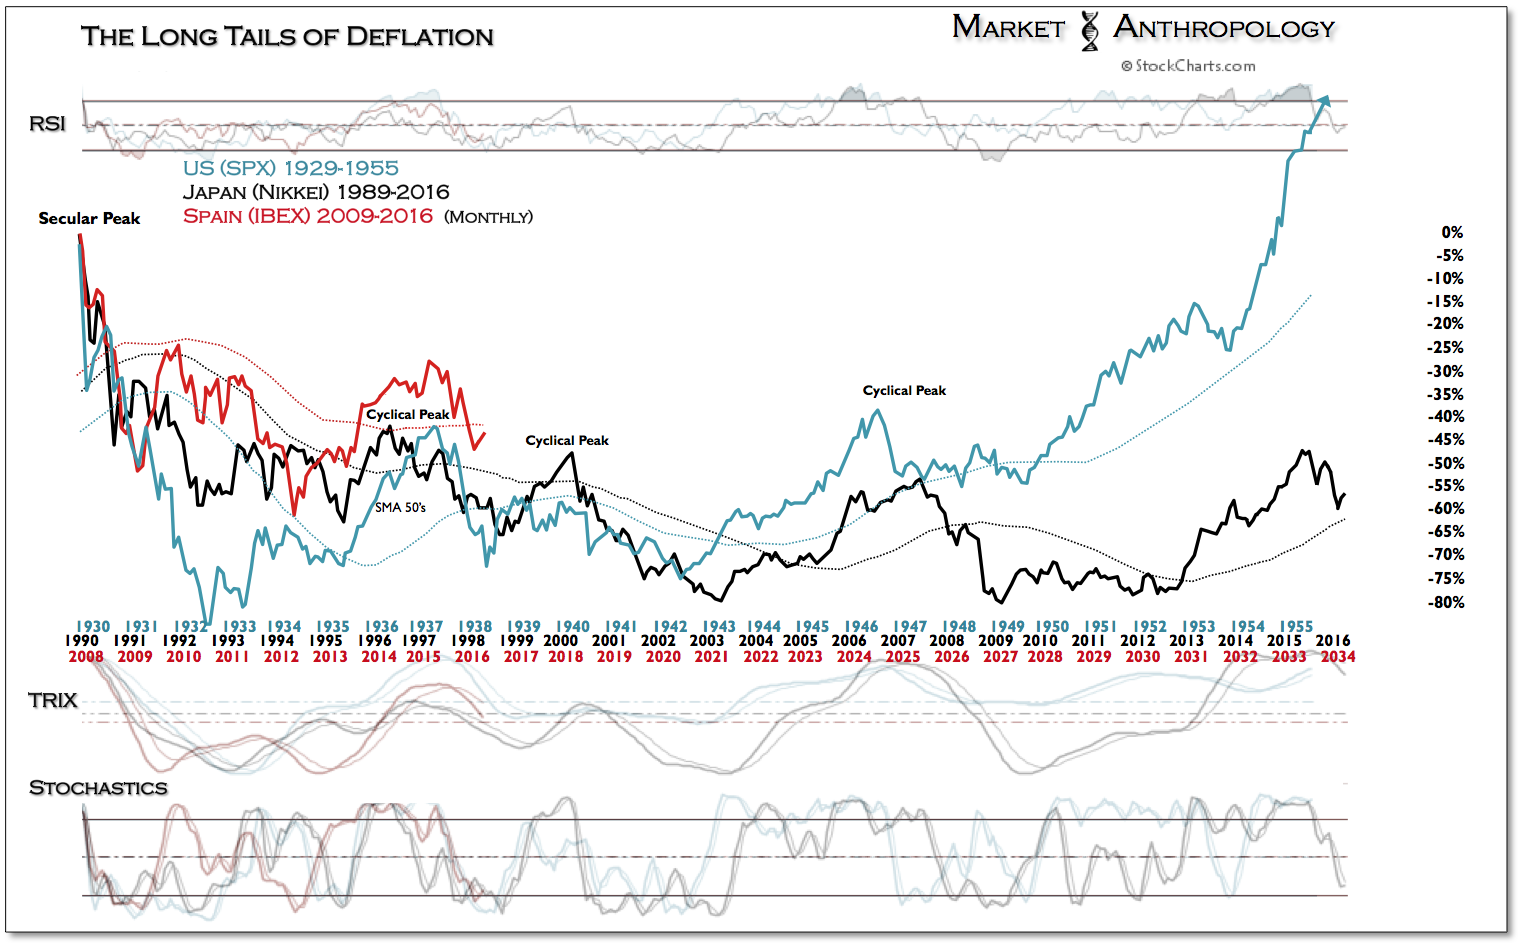
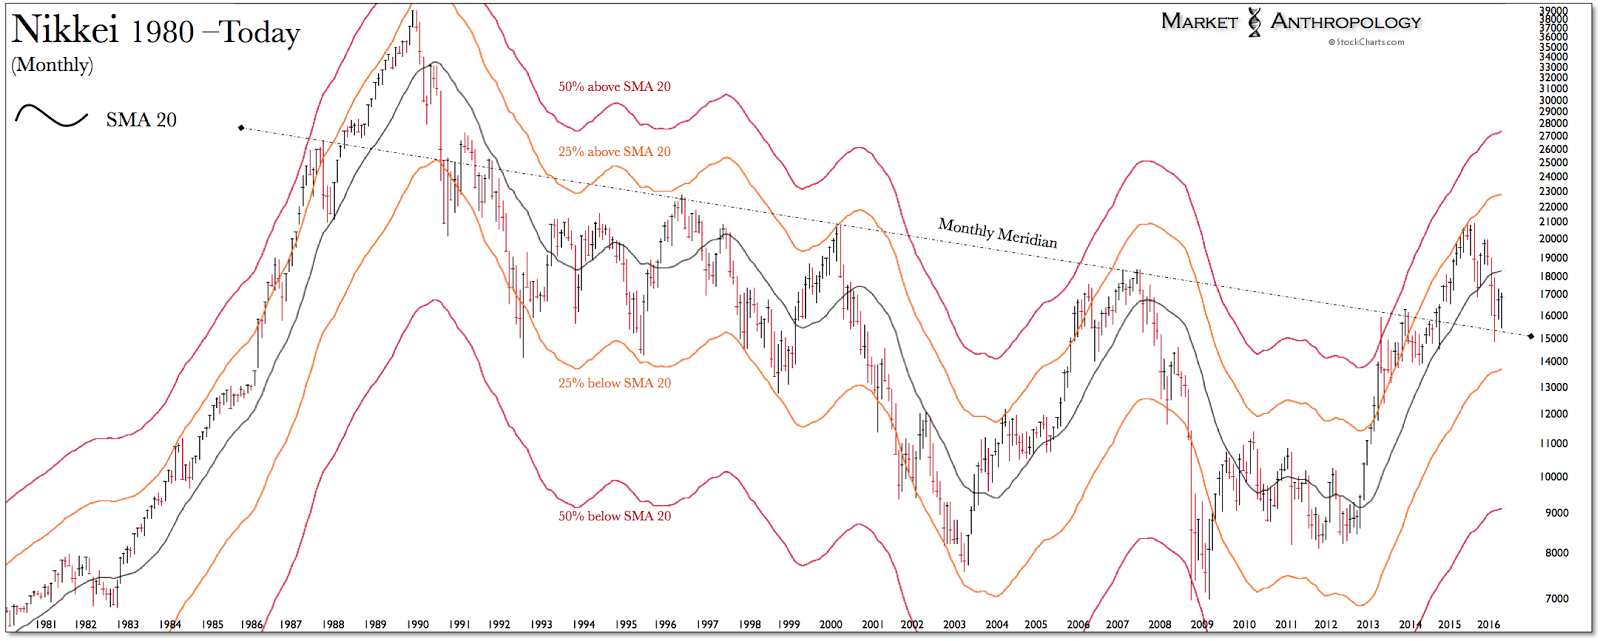
This applies to Japan as well, where the Nikkei this year has backtested the long-term breakout from 2014.
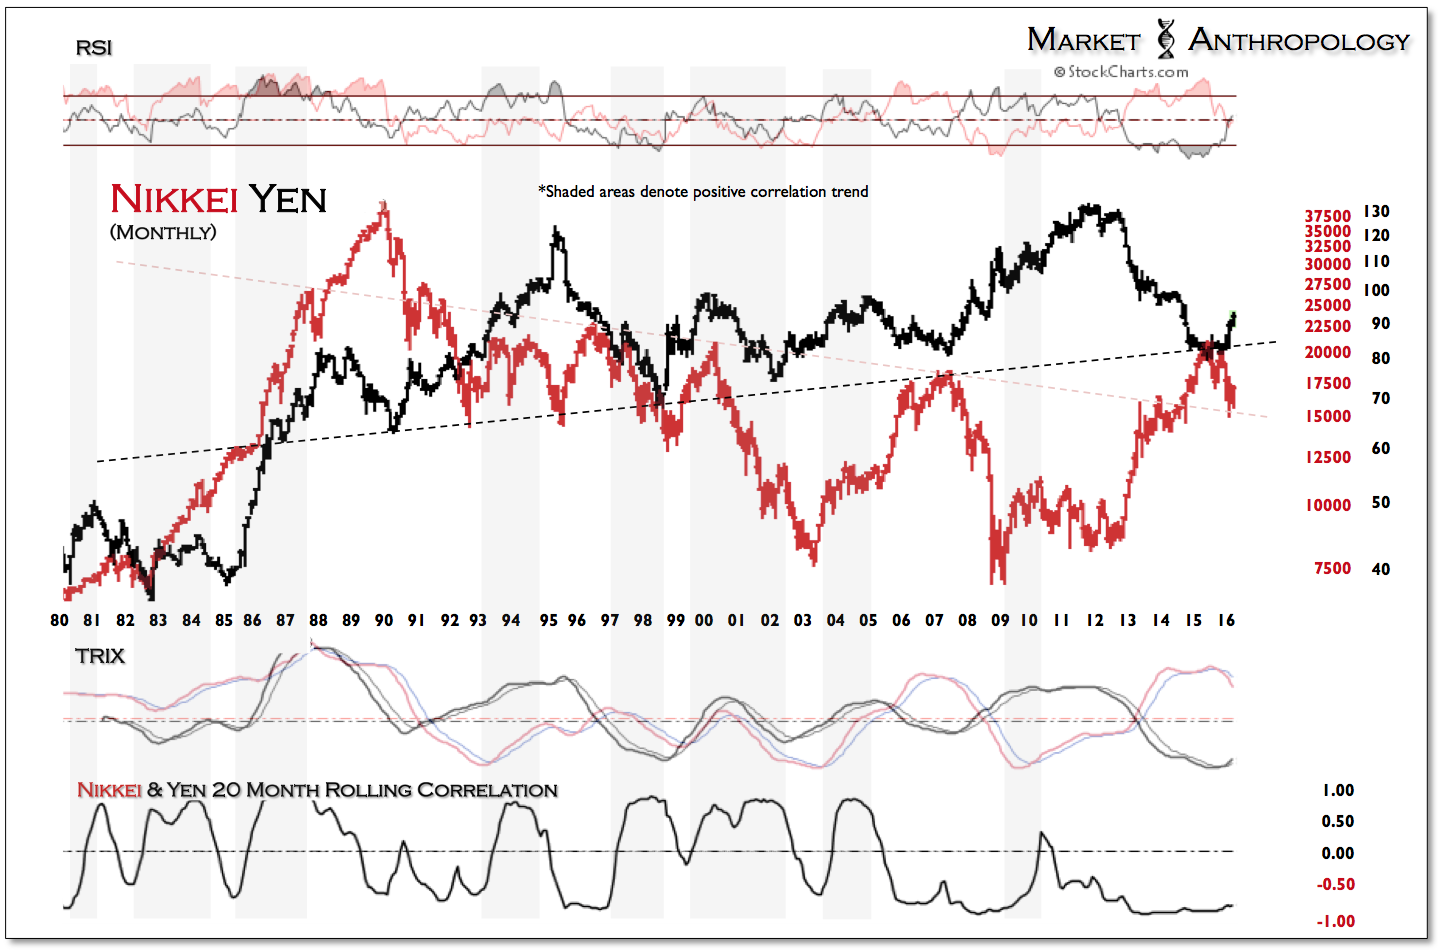
Should risk appetites recede again worldwide, it wouldn't surprise us to see the Nikkei continue to test this declining trend line through the next few quarters, before resuming its breakout move towards the end of this year. Considering the dollar's coincident set-up and the yen and Nikkei's crawl from their negative correlation extreme, both the yen and the Nikkei could trend lower for a spell, before both resolving higher.
