Get 40% Off
⚠ Earnings Alert! Which stocks are poised to surge?
See the stocks on our ProPicks radar. These strategies gained 19.7% year-to-date.
Unlock full list

The Phases Of The Dow Jones Composite

Published 04/26/2016, 09:17 AM
Updated 07/09/2023, 06:31 AM

Let’s take a step back at look at the Dow Jones Composite and the various phases it has gone through:
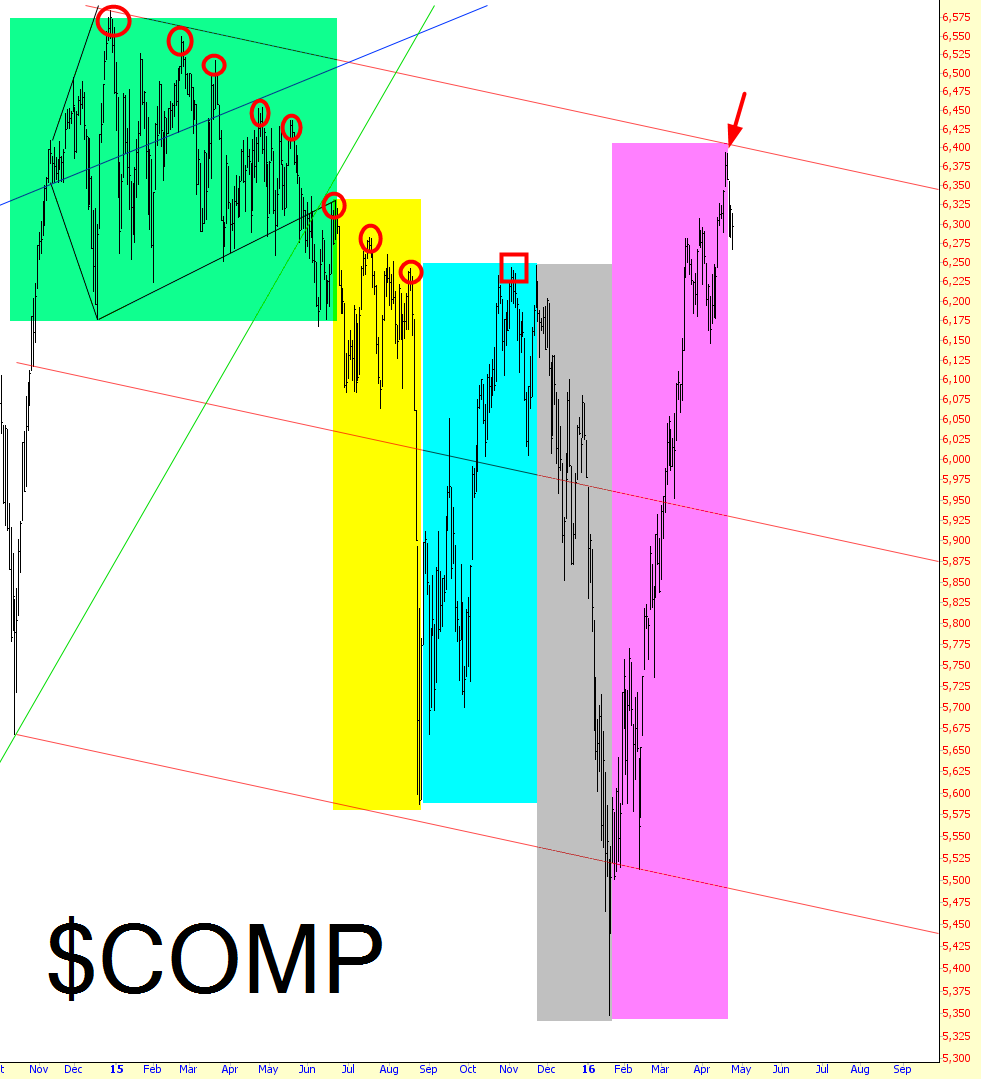
COMPQ Chart

GREEN was what I called the “Ichthus” pattern, which was remarkably well-formed and accurately predicted the drop that was to transpire. It had a clean series of lower lows, as well.

YELLOW was the first big plunge that terminated on that big day in late August when the Dow was down 1,000 points early on (if you can imagine such a thing now).

CYAN was the “we’ve got to do something!” rally, which resulted in a slightly higher high, breaking that clean series of circles you see.

GREY was when reality came back once more, aided largely by declining crude oil prices, creating a miniature bear market that spanned December 29 through January 20.

MAGENTA was the “we’ve really got to do something rally” that central bankers around the world led, this time aided by rising oil prices.

Prices threatened to break above the channel last week, as denoted by the arrow, but at this point, the channel is still containing price action.

We now all wait for more central banker nonsense on Wednesday, both from Yellen and Kuroda. My spidey sense is that there won’t be “big news” from either of them, but it’s the market’s reaction……….even to non-news……..that counts. Keep your eye on that channel for a breakout. If the market is chilly to the actions (or non-actions) of the bankers, it wouldn’t take much for prices to ease back down to about the 6,200 level.

Latest comments

Risk Disclosure: Trading in financial instruments and/or cryptocurrencies involves high risks including the risk of losing some, or all, of your investment amount, and may not be suitable for all investors. Prices of cryptocurrencies are extremely volatile and may be affected by external factors such as financial, regulatory or political events. Trading on margin increases the financial risks.
Before deciding to trade in financial instrument or cryptocurrencies you should be fully informed of the risks and costs associated with trading the financial markets, carefully consider your investment objectives, level of experience, and risk appetite, and seek professional advice where needed.
Fusion Media would like to remind you that the data contained in this website is not necessarily real-time nor accurate. The data and prices on the website are not necessarily provided by any market or exchange, but may be provided by market makers, and so prices may not be accurate and may differ from the actual price at any given market, meaning prices are indicative and not appropriate for trading purposes. Fusion Media and any provider of the data contained in this website will not accept liability for any loss or damage as a result of your trading, or your reliance on the information contained within this website.
It is prohibited to use, store, reproduce, display, modify, transmit or distribute the data contained in this website without the explicit prior written permission of Fusion Media and/or the data provider. All intellectual property rights are reserved by the providers and/or the exchange providing the data contained in this website.
Fusion Media may be compensated by the advertisers that appear on the website, based on your interaction with the advertisements or advertisers.
© 2007-2024 - Fusion Media Limited. All Rights Reserved.