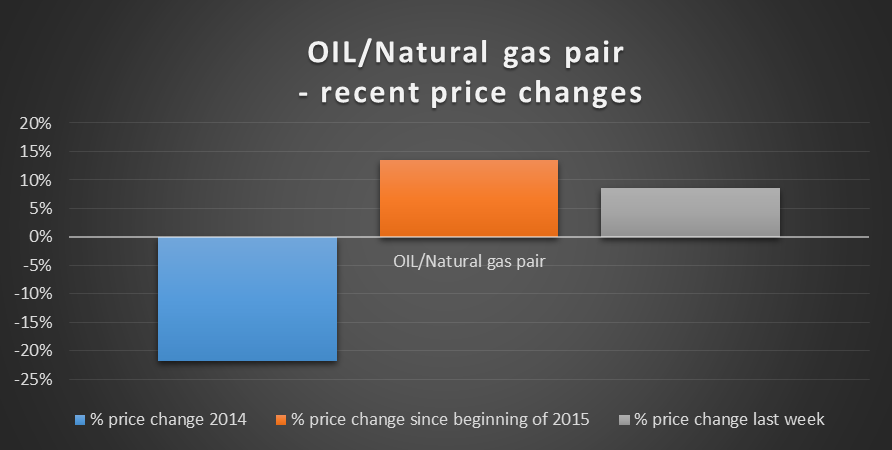
After the 2014 year of significant underperformance of the natural gas price by the crude oil price, this year has seen a resurgence of the oil price. The result has been an increasing price of the commodity pair: long oil, short natural gas. The graph below shows the performance of a pair ratio of 200 bbl oil (long) to 5000 Mmbtu natural gas (short).

In 2014, both commodities declined in price; the decrease in the price of the pair reflected steeper falls in the price of crude. This year, crude has firmed 3.3% whilst natural gas has declined 9%.
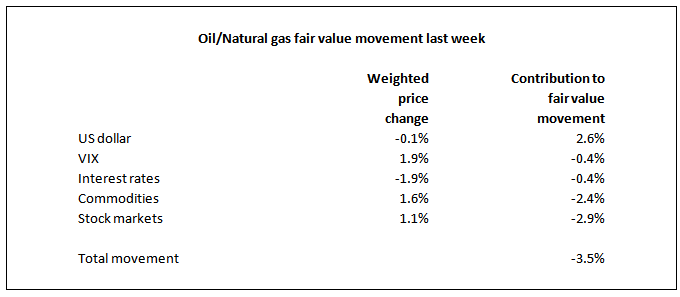
Over the last week, the crude oil price rose13.5% (to $55.23) whilst natural gas firmed 4.6% (to $2.73) to give an8.1% increase in the price of the pair. This was accompanied by a 3.5% fall in its fair value, analyzed in the table below –

Whilst the momentum is clearly with oil now, the disparity between price increase and fair value decrease would normally be a signal to sell or go short the pair (ie. go short oil, long natural gas). Following this signal over the last 90 days would have provided an annualized gain (on gross – long plus short - exposure) of 52.5% with volatility of 50.4%.
We have also applied this methodology to a number of other pairs of related securities – EUR/USD/gold, natural gas/GBP/USD, DAX/S&P 500, palladium/copper, S&P/ASX 200/FTSE 100, CAC 40/Nikkei and oil/EUR/USD. The portfolio of all these pairs traded using the disparity between price and fair value change (as above) has returned an annualized 35.4% with volatility of 4.8% over the 90 day backtest period. Hence the methodology supporting our recommendation backtests well over a range of securities.
We find a fair value of the oil/natural gas pair below the current price, suggesting that the pair is overvalued. Whilst this appears to confirm the signal analyzed above, trading the pair using an under/over value indicator over the 90 day backtest period showed a negative return, so for oil/natural gas do not draw comfort from this indicator.
Relationship to USD and volatility
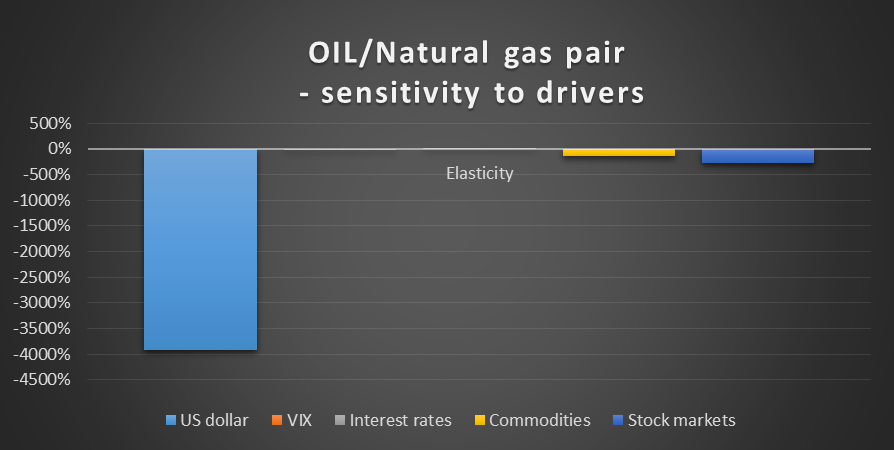
The graph below shows the sensitivity of the pair’s fair value to its drivers –

As can be seen, the oil/natural gas pair is highly negatively correlated to the US Dollar. This reflects the negative correlation of the oil price, and positive correlation of the natural gas price, to USD. Our fair value indicator currently suggests some short term downside in the US dollar index which would assist the pair trade recommended above.
An event potentially driving some movement in USD is the FOMC Minutes release today. Given the high sensitivity of the pair to the USD evident in the above graph, this could translate into volatility in the natural gas/oil pair price.
The historical volatility of the pair over the last 90 days, at 50%, is lower than the volatility for both natural gas (69%) and oil (55%) individually. This reflects some positive correlation between the two commodities and hence risk netting by pairing them.
Held in combination with a US equity portfolio, lower volatility and higher return may be achieved. A portfolio of 5% allocated to the pair (traded as recommended in this article) and 95% allocated to the S&P 500 index had a volatility of 12.4% over the last 90 days vs13.4% for 100% in the S&P 500. The annualized returns were 4.8% (5% allocated to pair) vs2.4% (100% S&P 500).
However, on its own the volatility of the pair is still high and confidence in predictions of price direction and position sizing, should be tempered accordingly.
