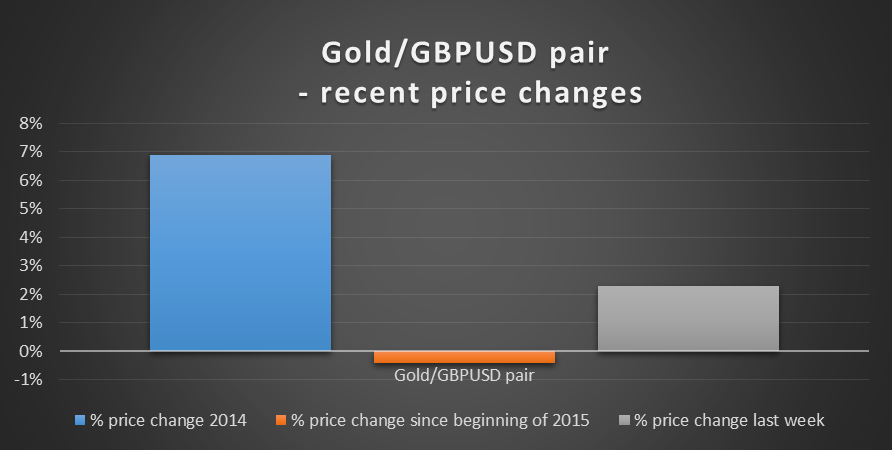
The strength of the US dollar against GBP/USD last year combined with a flat gold price (expressed in USD) pushed up the price of gold expressed in GBP. This year, the GBP price of gold has been fairly flat, with USD strength being similar against gold and GBP. The graph below shows the performance of a pair ratio of 10oz gold (long) to GBP10,000 of GBP/USD (short).

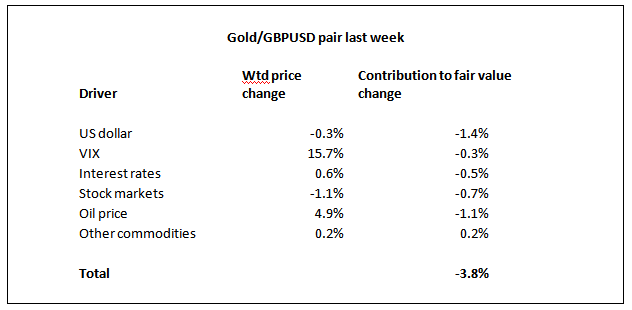
Over the last week, the gold price rose 1.4% (to $1,198) whilst GBP/USD weakened 0.8% (to 1.4870) to give a 2.2% increase in the price of the pair. This was accompanied by a 3.8% decrease in its fair value,driven by the factors analyzed in the table below:

A combination of fair value decrease and price increase would normally be a signal to sell the pair (buy GBP/USD, sell gold). Following this signal over the last 90 days would have provided an annualized gain (on gross – long plus short - exposure) of 28.2% with volatility of 12.0%.
We have also applied this methodology to a number of other pairs of related securities – EUR/USD/gold, natural gas/GBPUSD, DAX/S&P 500, palladium/Copper, ASX 200/FTSE, CAC40/Nikkei and Crude Oil/EURUSD. The portfolio of all these pairs traded using the disparity between price and fair value change (as above) has returned an annualized 35.4% with volatility of 4.8% over the 90 day backtest period.
We find a fair value of the gold/GBPUSD pair below the current price, suggesting that the pair is overvalued and confirming the signal analyzed above. Trading the pair using this indicator over the 90 day backtest period showed a breakeven return. For the portfolio of pairs described above, the annualized return was also breakeven. Hence we note the signal, but tend to place more reliance in the stronger performing price/fair value change disparity indicator.
Relationship to drivers and volatility
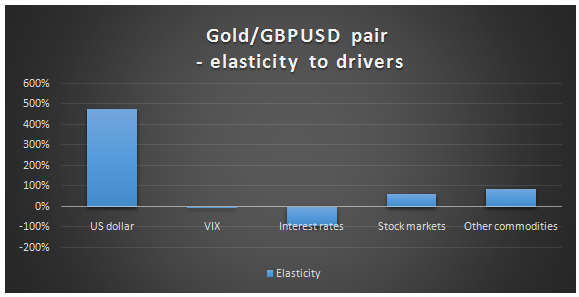
The graph below shows the sensitivity of the pair’s fair value to its drivers –

The long gold/short GBPUSD pair is on balance positively correlated to the US dollar (despite the gold price being negatively correlated to USD). Our fair value indicators now suggest some short term upside in the US dollar index which poses a risk factor to the pair trade (long GBPUSD/short gold) recommended above.
The USD may undergo some volatility this week if the jobs data reads come in some distance from consensus. Given the sensitivity of the pair to the USD evident in the above graph, this could translate into volatility in GBPUSD and the gold price.
For the last three years, the volatility of the gold/GBPUSD pair in the week leading up to the nonfarm payrolls print has been 9% higher than the volatility for all weeks over the period. The historical volatility of the pair over the last 90 days, at 12.0%, is between the volatility for GBPUSD (9.2%) and gold (15.4%) individually.
Held in combination with a US equity portfolio, lower volatility and higher return may be achieved. A portfolio of 5% allocated to the pair (traded as recommended in this article) and 95% allocated to the S&P 500 index had a volatility of 12.5% over the last 90 days vs 13.2% for 100% in the S&P 500. The annualized returns were -2.6% (5% allocated to pair) vs -4.5% (100% S&P 500).
