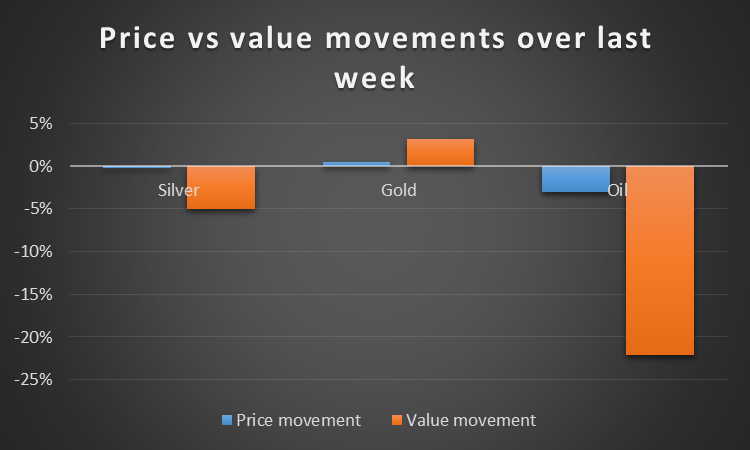
Our fair value monitor shows that over the last week, divergences between fair value movement and actual price movement occurred for spot silver and oil (Brent crude), with lesser divergences for gold. The indicator suggests short term downside for silver, significant downside for oil and some upside for gold.
Silver
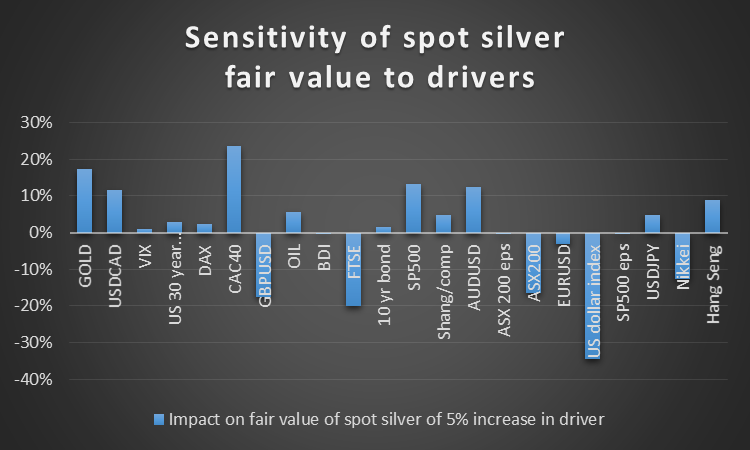
The complexity of the driver profile for silver is highlighted by the chart below. Little surprise that the commodity price is so volatile, with an annualized volatility of 55% (vs eg. gold 31%). Although the go-short signal is not overly strong given the volatility, following the signal over the last 90 days would have yielded an annualized gain of 62.8% with annualized volatility of 34%.
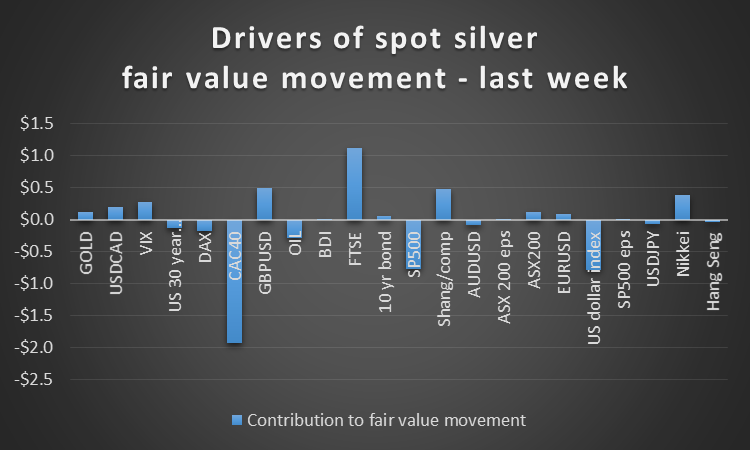
The divergence between price and fair value movement would be eliminated if silver falls to $14.30, assuming no movement in fair value. However the fair value will move, and the chart below shows what will drive it.
Gold
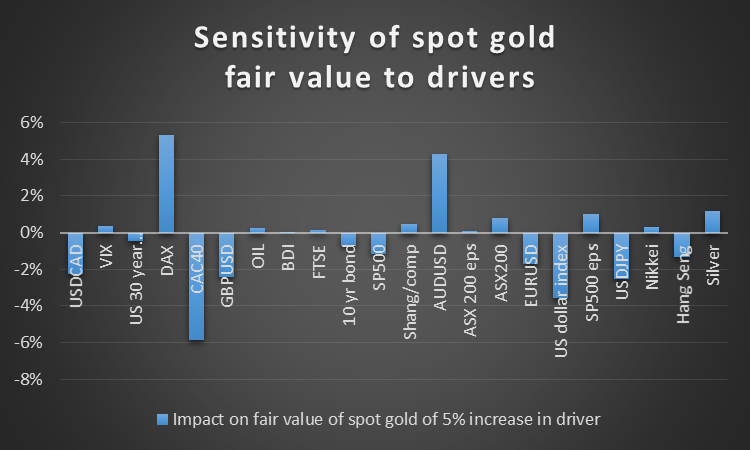
The gold price shows strong positive correlation to the VIX and AUD/USD and as expected, negative correlation to the US dollar index. Unfortunately, gold has been our indicator’s poorest performer, with an annualized loss of 42.6% and volatility of 19% over the last 90 days. However, in an equally-weighted portfolio of silver, gold and oil an annualized gain of 69% against volatility of 16% would have been achieved over the last 90 days. We would include gold in such a portfolio as it reduces the volatility from 19% to 16% and diversifies the back test performance risk.
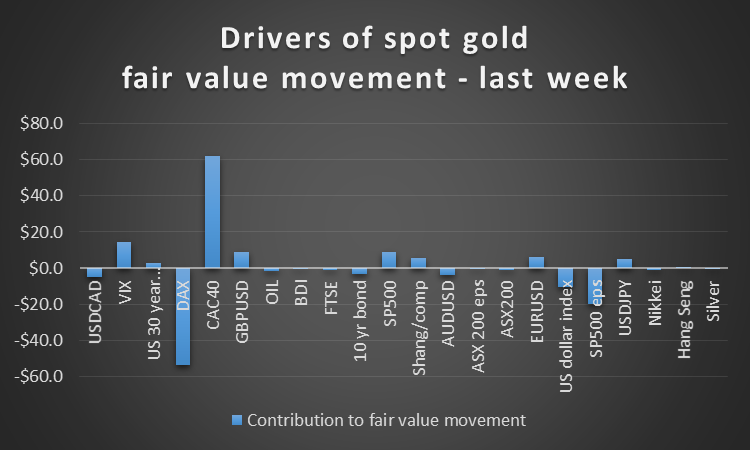
The divergence between price and fair value movement would be eliminated if gold rises to $1223, assuming no movement in fair value. However the fair value itself will move, depending on the movement in its drivers. The sensitivities are shown in the graph below.
Oil
As can be seen from the chart below, the fall in fair value of oil over the last week has been very much a US dollar strength story (the dollar index increased 1.3%).
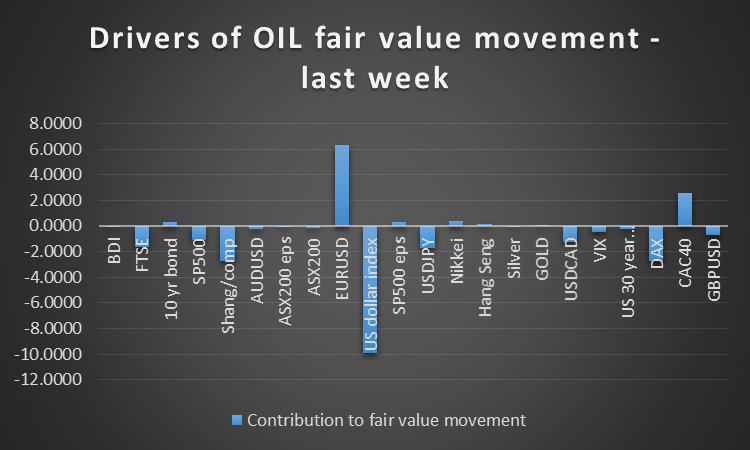
Following our divergence indicator over the last 90 days would have yielded an annualized return of 192% with annualized volatility of 25.5%.
The divergence between price and fair value movement over the last week would be eliminated if oil falls below $50, assuming no movement in fair value. However the fair value itself will move, depending on the movement in its drivers. The sensitivities are shown in the graph below.
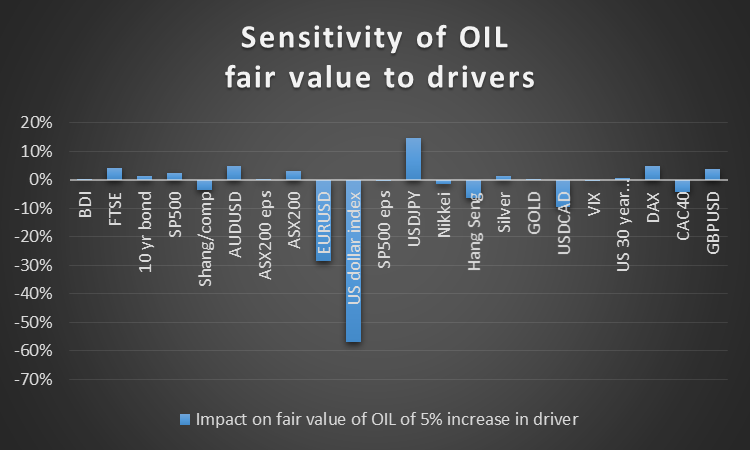
As we noted above, further strength in the US dollar will likely weaken oil.
What supports the discussion?
We make fair value estimates for 27 series using multiple regression analyses of 6.5 years of daily price data. The series are:
Tradeable securities
Stock indices:
DAX, CAC 40, FTSE, S&P 500, Shanghai Composite, Hang Seng, Nikkei, ASX 200
USD currencies:
USD/JPY, GBP/USD, AUD/USD, EUR/USD, USD/CAD
Cross currencies:
AUD/GBP, AUD/CAD, GBP/JPY, EUR/GBP
Commodities:
Oil (brent crude), Silver, Gold
Other driver variables used in the regressions:
VIX, S&P 500 earnings per share, ASX 200 earnings per share, US dollar index, U.S. 30-Year bond rate, Australian 10-Year bond rate, Baltic Dry Index.
For all the series excluding the cross currencies, 23 regressions are run with the other 22 series being independent (driver) variables. The goodness of fit is very high with “R-squared” typically above 95%. The regressions are rerun weekly with a rolling dataset kept at 6.5 years (the earliest week is dropped off as the latest is added).
For the cross currencies, the series applying to each currency is regressed against 22 of the other series (excluding the other cross currencies).
Each day, the previous day’s closing prices are input into the equations to give an updated fair value estimate for each of the 27 variables. A percentage under/over valuation is calculated by relating the latest prices to the updated fair value estimates (to show as undervaluation if latest price is less than fair value and over valuation if conversely).
Also shown is the price/fair value ratio applying now minus that applying five trading days previously. This gives an indication of whether the security has become relatively more expensive (increase in price/value ratio) or relatively cheaper (decrease in price/value ratio) over the last five trading days. The above discussion reflects use of this indicator in that AUDUSD has become relatively more expensive over the last week.
