Get 40% Off
🚨 Volatile Markets? Find Hidden Gems for Serious OutperformanceFind Stocks Now

Commodities Reflect Global Tensions

Published 06/17/2014, 03:22 AM
Updated 07/09/2023, 06:31 AM

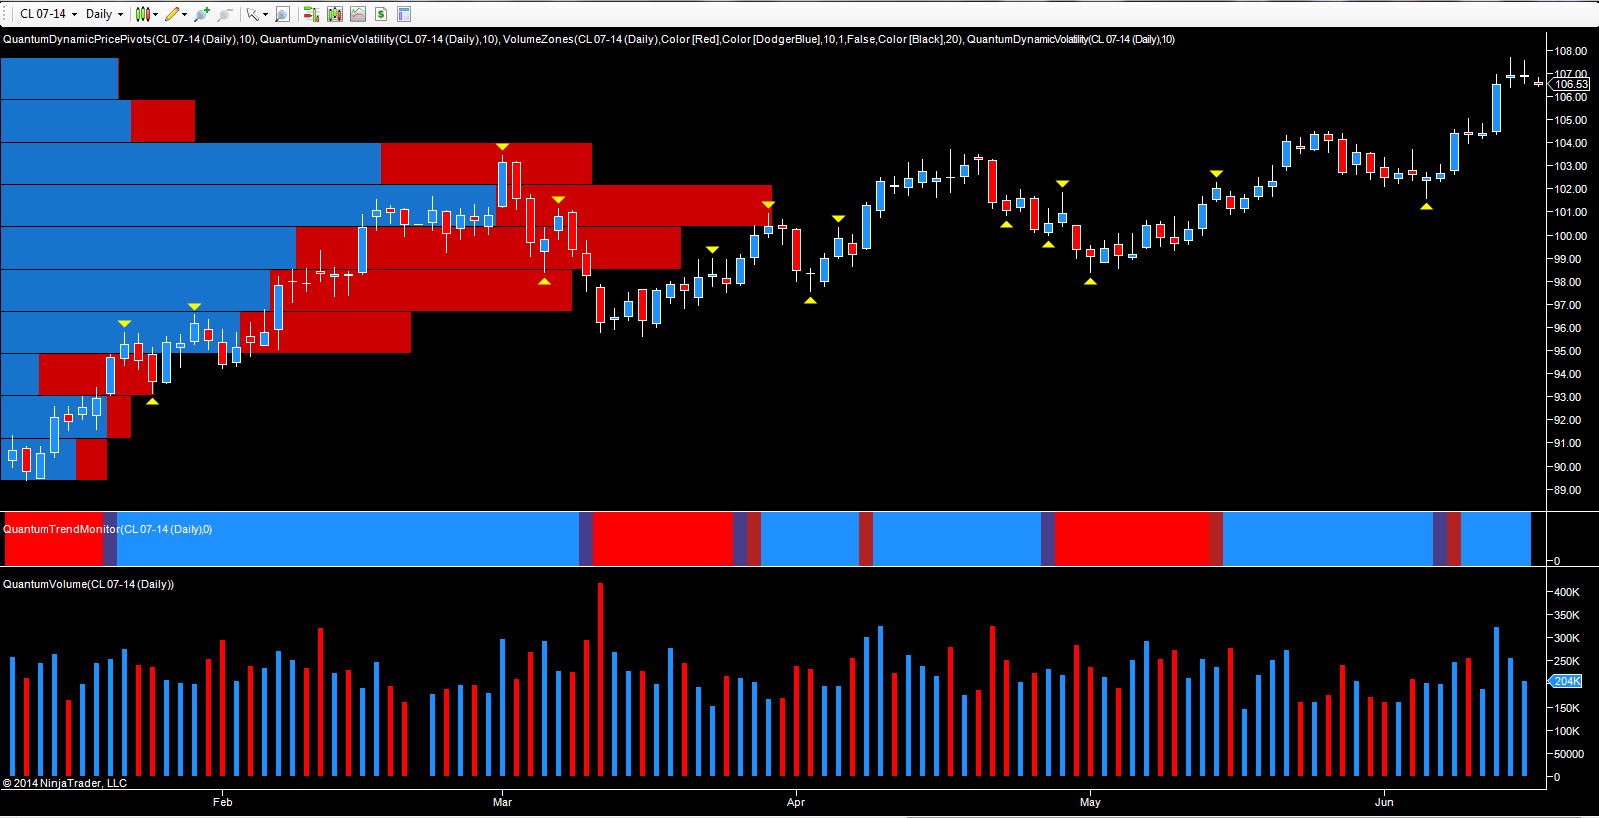
WTI July futures – daily chart

In any escalation of political tension Oil and Gold are the two key commodities to watch. For oil, the breakout and surge higher was largely driven by events in Iraq coupled with supply issues at Cushing, both of which combined to help power the WTI contract up to the $107 per barrel price point as evidenced by last Thursday’s wide spread up candle.

This move higher was associated with high volume, thereby validating and confirming this bullish picture. Both Friday’s and Monday’s price action was identical, in that both trading sessions closed with small shooting star candles on above average volume, suggesting that like equities, markets are pausing and waiting for further news and developments. It is also interesting to note that the volume since Thursday has fallen away, once again signaling a temporary reversal from the current price level and a possible move back, in the short term to $106 per barrel (or lower), before oil resumes its longer term bullish trend.
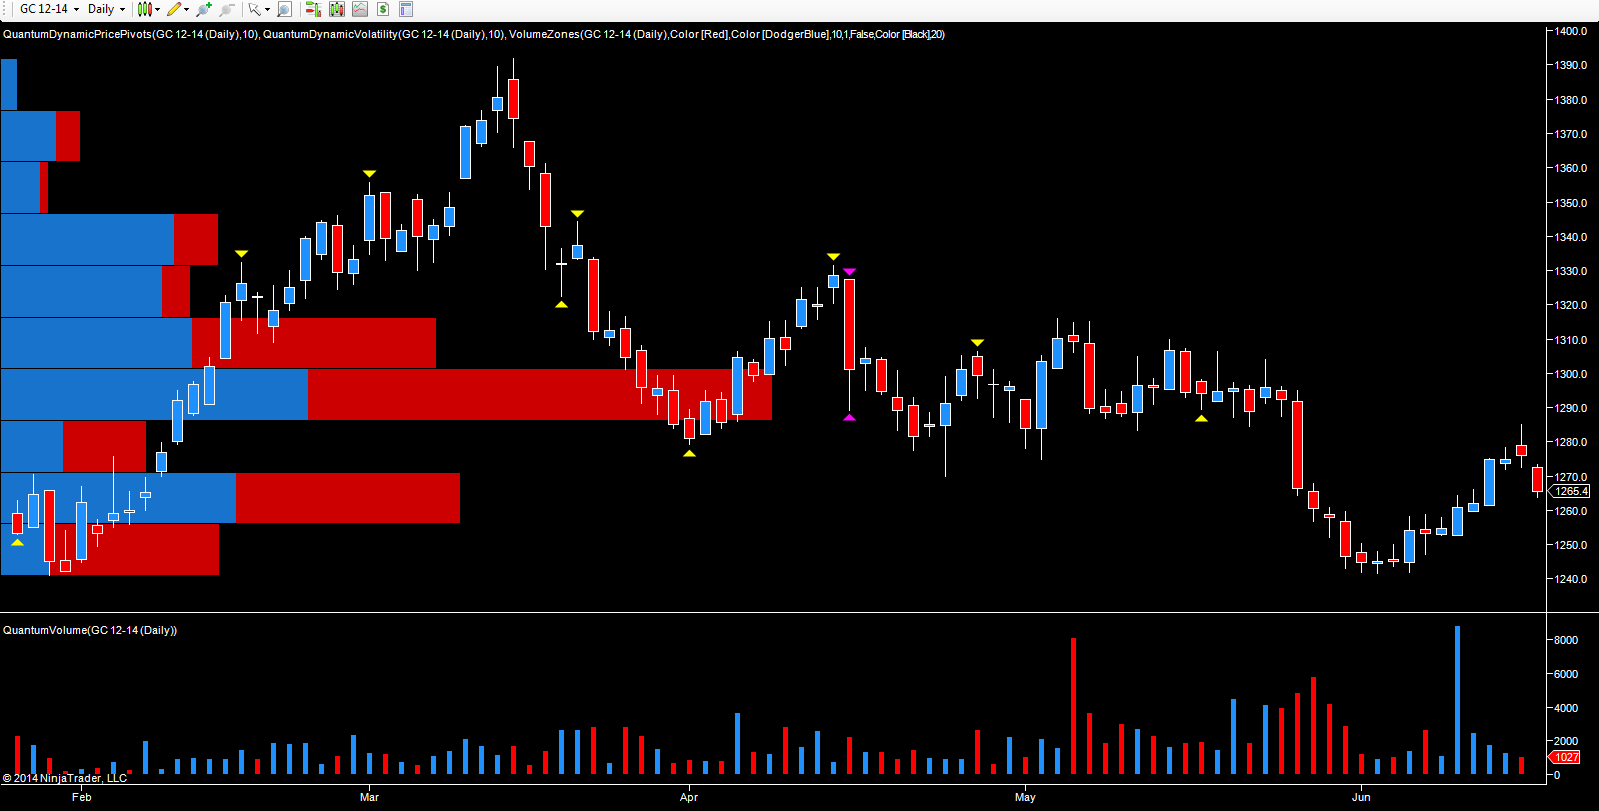
December gold futures – daily chart

Moving to gold, this too spiked higher, driven by fundamental news as traders and investors sought out gold as a traditional safe haven asset. This sentiment saw the precious metal move from the $1260 per ounce region to touch a high of $1285.20 before reversing in overnight trading to trade (at time of writing) at $1265.50 on the December contract on Globex.

As mentioned in a previous post on gold, this rally was expected to run out of steam given the massive surge in volume on 10th June, but which was coupled with weak price action. However, since then the move higher (and further confirming this view) has seen a dramatic fall in volume coupled with a rising market, and sending its own signal of weakness. In addition, gold has also run into the solid band of resistance in place at the $1285-$1300 per ounce region, which again is defined by the volume at price histogram at the left hand side of the chart. However, as with oil, any gold analysis has to be taken with a grain of salt given the current tensions, but from a technical perspective the outlook for gold still remains bearish.

3rd party Ad. Not an offer or recommendation by Investing.com. See disclosure here or remove ads .

Latest comments

Risk Disclosure: Trading in financial instruments and/or cryptocurrencies involves high risks including the risk of losing some, or all, of your investment amount, and may not be suitable for all investors. Prices of cryptocurrencies are extremely volatile and may be affected by external factors such as financial, regulatory or political events. Trading on margin increases the financial risks.
Before deciding to trade in financial instrument or cryptocurrencies you should be fully informed of the risks and costs associated with trading the financial markets, carefully consider your investment objectives, level of experience, and risk appetite, and seek professional advice where needed.
Fusion Media would like to remind you that the data contained in this website is not necessarily real-time nor accurate. The data and prices on the website are not necessarily provided by any market or exchange, but may be provided by market makers, and so prices may not be accurate and may differ from the actual price at any given market, meaning prices are indicative and not appropriate for trading purposes. Fusion Media and any provider of the data contained in this website will not accept liability for any loss or damage as a result of your trading, or your reliance on the information contained within this website.
It is prohibited to use, store, reproduce, display, modify, transmit or distribute the data contained in this website without the explicit prior written permission of Fusion Media and/or the data provider. All intellectual property rights are reserved by the providers and/or the exchange providing the data contained in this website.
Fusion Media may be compensated by the advertisers that appear on the website, based on your interaction with the advertisements or advertisers.
© 2007-2024 - Fusion Media Limited. All Rights Reserved.