Talking Points:
- Gold gets a lift from Europe (and US) equities exodus
- Copper’s tightly escaped a clear break of support thanks to flat USD
- Oil supplies are clearly abundant, no hints from EIA
Gold and safe-haven assets benefited from the exodus out of European equities (and to a lesser extent global equities): Italy’s FTSE/MIB stock index made headlines with a 2.5 percent loss, Greek stocks gave up 4.6 percent and the UK’s FTSE 100 fell 1.1 percent to the lowest level since March. The S&P 500 – the US benchmark - was down slightly at -0.6 percent.
US Industrial Production fell 0.2 percent in May, marking the sixth consecutive decline. US factory production was up by a meager 1.8 percent y/y – barely above its peak in 2008. This divergence from recently positive US data saw the US dollar stabilize in anticipation of comments from tomorrow’s FOMC meeting.
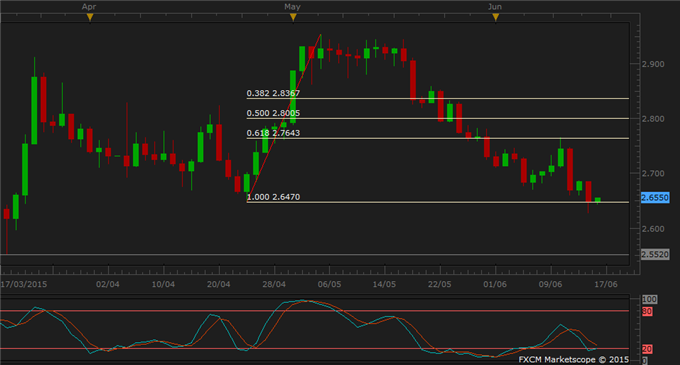
Copper reversed yesterday’s break of support at 2.6470 dating from the April-June period, finishing the day at 2.6480. Failure to deliver follow-through on the breakout may indicate the presence of upward pressure, which could keep the metal in a range, derailing the resumption of the May decline. Contango is widening in copper futures contracts, indicating ample supplies and downside price risk. The gap between spot and 3-month futures is the widest since October 2013.
Apart from on-coming US dollar volatility, oversupply remains the driver for crude oil prices, with medium to long-term downside price projection and short-term flatness expected. Oil supply has exceeded demand for the past 5 quarters, marking the largest glut since 1997 Asian crisis, according to EIA data reported by Bloomberg. This seems likely to persist through to 2016, with Saudi Arabia likely to increase production while Iran works on a deal to ease sanctions on exports by June 30. Speaking in Vienna last week, Iranian Oil Minister Bijan Namdar Zanganeh said the country could contribute extra 1 million barrels/day within 7 month of operation if negotiations are successful.
According to Bloomberg, the EIA projection for global demand and non-OPEC production as well as the OPEC’s current surplus (1 million barrels/day) implies global oversupply of 600,000 barrels/day for the next 3 months. No significant guidance seemed to emerge from the EIA Conference in Washington DC, save for a comment from US Energy Secretary Ernest Moniz, who remarked that that the country's Strategic Petroleum Reserve should be used to stabilise any oil price shock for domestic consumers.
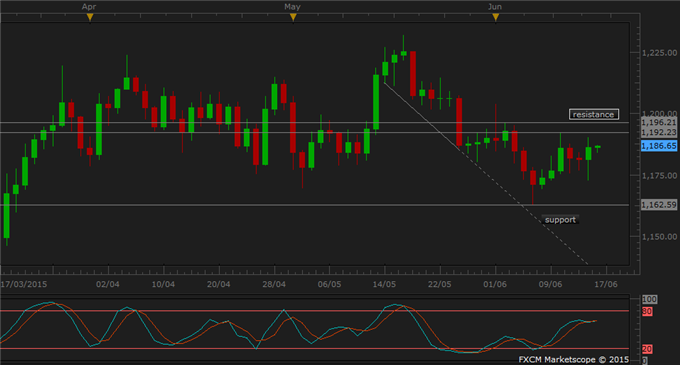
GOLD TECHNICAL ANALYSIS – Gold continues to move sideways for the fourth consecutive day, but prices remain a safe distance away from support at 1162.5. Attention is on the topside, with two close-by resistance levels at 1192.2 and 1196.2. These are holding firm for now until momentum returns. While unexpected volatility linked to the close proximity of the FOMC meeting and Thursday’s Eurogroup meeting may trigger a test of resistance and a light break, directional conviction is likely to be absent until after event risk passes.

COPPER TECHNICAL ANALYSIS – Copper failed to stage a clear break of the April-June support level at 2.6470 in yesterday’s session, returning back above it today. This is in line with exhaustion signaled in momentum studies. Today’s test for the metal will be whether it can breach support to continue the pattern of lower lows that started after last week’s reversal. Failure on this front will disperse some downward pressure, and mark a transition to sideways movement until key event risk passes

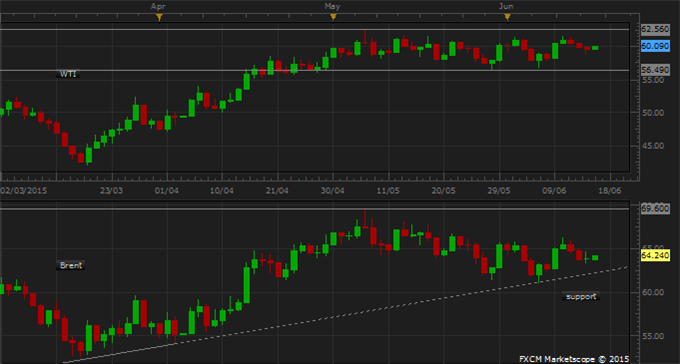
CRUDE OIL TECHNICAL ANALYSIS –Slim news-flow from the EIA Conference and a flat US dollar has allowed oil to stabilize ahead of big event risk in the US and Europe. WTI has paused in middle of its 56.26-62.56 range, while Brent treads lightly along trend line support (at 62.58 today). US dollar fluctuations ahead of the FOMC meeting may translate into crude oil fluctuation, but these should be unremarkable until after the outcome crosses the wires.

