Commodities in general have been under pressure for the last couple years. This can be seen by looking at the GCC Greenhaven Continuous Commodity ETF which holds a basket of resources.
The weekly chart has formed a bullish bottom pattern, and as of last January it looks as though it’s now building a basing pattern. Overall commodities are in the very early stages of a stage 1 basing pattern and it looks as though it will be a few more months before any significant breakout will occur. But there could be some early entry points if you know what to look for…
A few days ago I talked about how commodities tend to perform well near the end of a bull market in the United States stock market. I also pointed out which hot index was going to benefit from this.
Read Commodity Index Report: http://www.gold-eagle.com/article/gold-and-oil-fuel-canadian-stock-market-rally
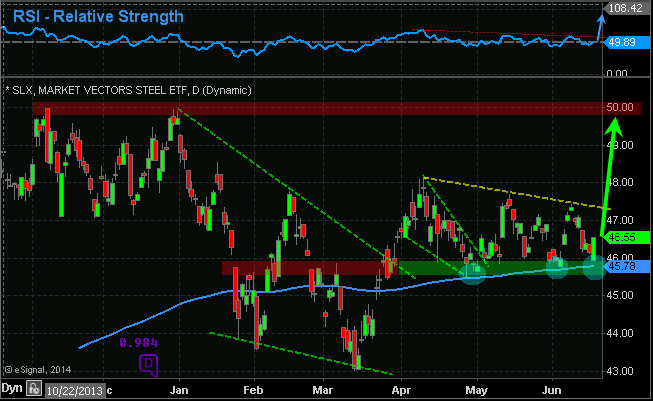
In this article I want to bring your attention to the steel market. Using the SLX Steel ETF you can clearly see the bottoming pattern and basing pattern for this commodity.
Currently steel is underperforming the stock market and is vulnerable to lower prices. But if we see a few things come together in the coming days or weeks, this could be a screaming buy.
My technical take on steel is this:
SLX has formed a bottoming pattern from January – mid March. It has since put in a strong impulse rally to make a higher high, and is now consolidating above key support. The RSI (Relative Strength) remains in a down trend, but if this starts to rise and SLX breaks above its recent highs around the $47.75 level I feel steel will start to rally with $50 being the next major whole number and previous high for steel to find some resistance.
Also price has been riding along the 200 day moving average which is acting as support. If price closes a couple of days below the 200 moving average I would consider this to be a bearish sign.

Steel Trading Conclusion:
In short, we are looking for the relative strength to start making new highs. Also we want to see a reversal bar on the SLX chart to the upside which we got on Tuesday. Or you can wait for a breakout and close above $47-48 area. Stop would be somewhere around the $45.75 area to start, then raise it as price rallies using intraday pivot lows on the 30 minute chart.
