It has been a very interesting and volatile start to the year, as we get ready to close out the first quarter of 2016. Let's summarize year-to-date total returns for all major asset classes:
- United States Equities (SPDR S&P 500 (NYSE:SPY)): 1.1%
- Eurozone Equities (SPDR Euro Stoxx 50 (NYSE:FEZ)): -3.4%
- Japanese Equities (iShares MSCI Japan (NYSE:EWJ)): -4.0%
- Asia ex Japan Equities (iShares MSCI All Country Asia ex Japan (NASDAQ:AAXJ)): 1.3%
- Emerging Market Equities: 4.8%
- US Treasury Notes (iShares 7-10 Year Treasury Bond (NYSE:IEF)): 4.6%
- US Treasury Bonds (iShares 20+ Year Treasury Bond (NYSE:TLT)): 9.1%
- US Treasury Inflation Notes (iShares TIPS Bond (NYSE:TIP)): 4.4%
- Investment Grade Bonds (iShares iBoxx $ Investment Grade Corporate Bond (NYSE:LQD)): 4.5%
- Junk Grade High Yield Bonds (iShares iBoxx $ High Yield Corporate Bond (NYSE:HYG)): 1.9%
- United States REITs (Vanguard REIT (NYSE:VNQ)): 5.8%
- Global ex USA REITs (Vanguard Global ex-US Real Estate (NASDAQ:VNQI)): 4.7%
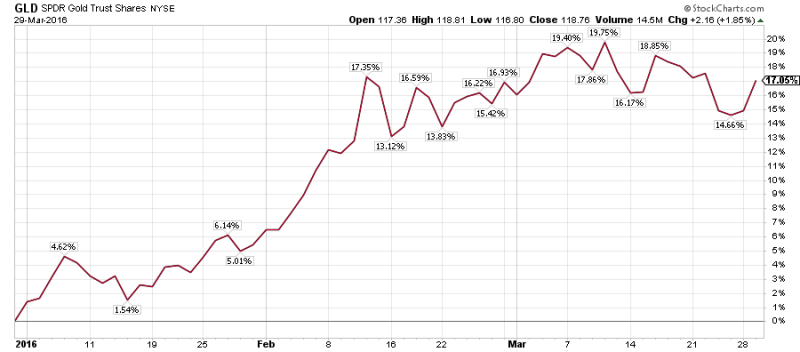
- Gold and Platinum ( SPDR Gold Shares (NYSE:GLD), ETFS Physical Platinum Shares (NYSE:PPLT)): 17.1%, 8.7%
- Rogers Commodities Index (NYSE:RJI): -0.9%

Gold had a fabulous quarter, up a massive 17%. At one point in early March, Gold’s return was close to 20% – quite a powerful rally indeed. Gold sentiment has become extremely elevated, so if you want to add positions right now, I would advise not to chase this rally. Call buying is very elevated, quarterly inflows of hot money are in abundance and hedge fund positioning (dumb money) via the futures market has risen too fast (even more so for Silver). Finally, the Gold Mining Index is trading at a historically extreme level relative to its 200 day moving average.
Moving along, Treasury Long Bond returns were also just as impressive, while global stocks continued to underperform. It is worth mentioning that the most hated region for equities has been the emerging markets, and its outperformance has come as no surprise to us. We did recommend this asset class, due to its attractive valuation, during the bottom in January. On the other hand, darlings of the investment world (Japanese and Eurozone equities) once again underperformed, despite ongoing central bank QE programs.
This is usually what happens to assets when they are loved and consistently overweighted. Another good example is everyone's favourite from last year, the Biotech sector, which is still without a recovery and probably going to new lows.

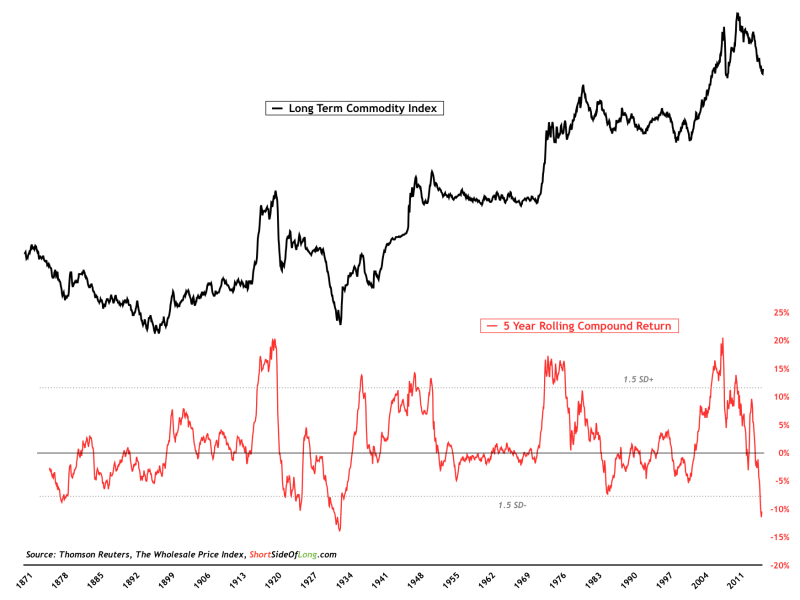
Applying this contrarian approach to investing, some readers might ask what is the most hated asset right now and where are investors most underweight? My thinking and approach lead me to the commodities index, and here is why. Raw material prices have been down for unprecedented 5 years in the row, something that didn’t even happen during the 1980s bust (most of us don’t remember the 1930s or 1950s busts).
Furthermore, the 5 year CAGR (compound annual growth rate) recently touched a negative reading of 12%. In plain English, that is a loss of 12 percent year on year, for 5 straight years. Talk about negativity!
My historical data shows that this type of selling pressure, and this type of underweight positioning, hasn’t occurred in the commodities market for over eight decades. We have to go all the way back to The Great Depression to witness something similar. Mind you, I am being fair by using the Continuous Commodity Index (equal weighted measure)—but if one was to use the CRB Index, Goldman Sachs' Commodity Index or the Rogers Commodity Index—since late 1990s, the 5 year CAGR readings would be even worse.

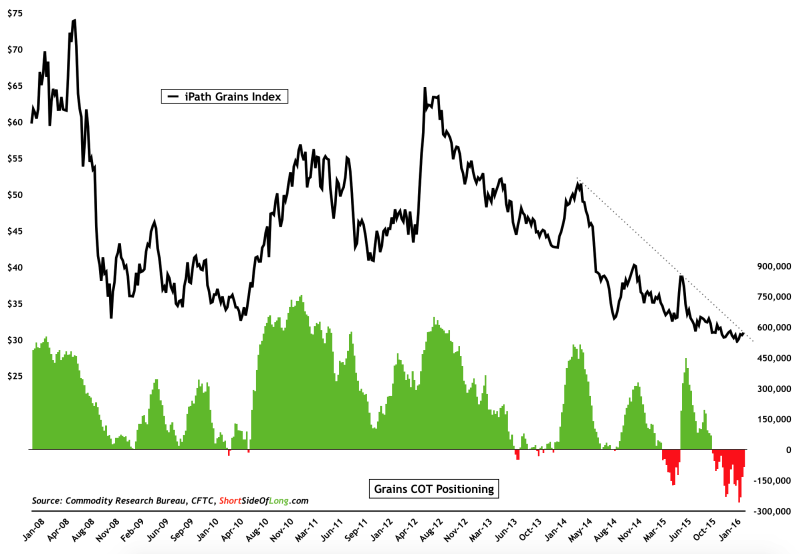
In our last post in early March, we did recommend exposure to the Agricultural Index (ETFs: JJA, RJA, DBA and so forth). We stated that we preferred to hold exposure in the very depressed and completely forgotten grains sub-sector (Corn, Soybeans and Wheat). I still continue to expect that the recent strong El Nino swiftly turns into La Nina over the coming quarters. This might propel prices higher. We are comfortable with our grains exposure and have noticed that hedge funds and other speculators don’t seem to agree with us…that's the way we like it.
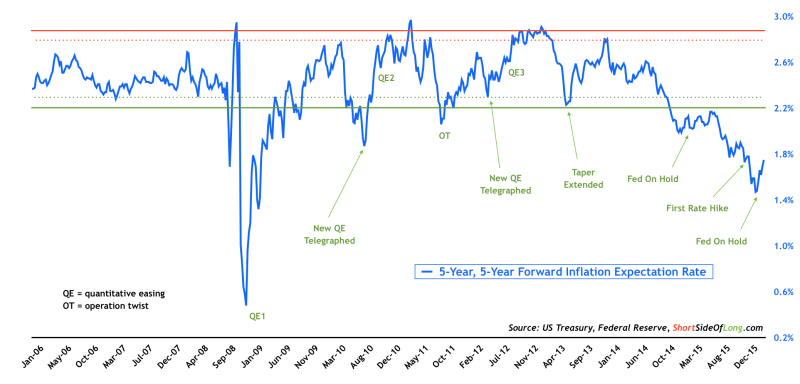
The Fed’s recent dovishness is putting pressure on the US dollar, and in turn helping fuel the so called “inflation trade”. Gold is rallying and we are turning very bullish on Agriculture. Moreover, as recommended in the last post, an up-and-coming trade in the bond market could be Inflation Linked Bonds (TIPS). I would like to remind readers that deflation worries are even higher today, than what we experienced during depths of the Global Financial Crisis of 2008.

Such conditions did not warrant high demand for inflation protection, so naturally TIPS have been out of favour for the last few years. However, from a contrary perspective, this depressed asset class might surprise on the upside if we see further stabilisation and recovery in commodities (as discussed above).
Also worth noting, 5 Year Break Evens (measure of inflation expectations) have began to rebound. We would like to add more TIPS to our existing position on any meaningful weakness.
Bond Market Summary:
- After a stellar rally in the Corporate Bond market (mainly thanks to Super Mario and the ECB’s Bazooka), we plan to take some money off the table as soon as the coming monthly interest payments are made. Nevertheless, we continue to hold a substantially high position.
- Apart from New Zealand and Australia, Treasury Notes are the highest yielders over the next decade in the developed world (we don’t count Greece and Portugal as developed markets!). I think this is miss-priced, so I am expecting US yields to drop further (as they have already this week). We’ve added to our positions.
- The recent rebound in Junk Bonds is quite impressive for those who have a trader's horizon, however my view is that there is above-average probability the recent lows won’t hold. During the recent narrowing in credit spreads, we chose to participate via investment grade instead of junk. We don’t hold long nor short exposure here, but we wouldn’t chase this rally.
Wishing you a very prosperous April…a month famous for the strongest stock market returns.
