
On Oct 26, 2016, Chinese offshore giant CNOOC Ltd. (NYSE:CEO) reported third-quarter 2016 total revenue of 30.75 billion yuan ($4.6 billion), down 15.2% from the year-earlier level. The quarterly results were hurt by lower oil price realizations.
Production
In the third quarter, CNOOC’s net production was 117.7 million barrels of oil equivalent (MMBoe), down 7.7% from the year-ago level. The decrease in production is mainly attributable to a decline of production volume in oil and gas fields and weaker demand in the domestic downstream gas market.
Price Realizations
The company’s average realized oil price was down 13.5% year over year to $42.26 per barrel. Realized gas price plunged 18.6% from the year-ago level to $5.22 per thousand cubic feet (Mcf).
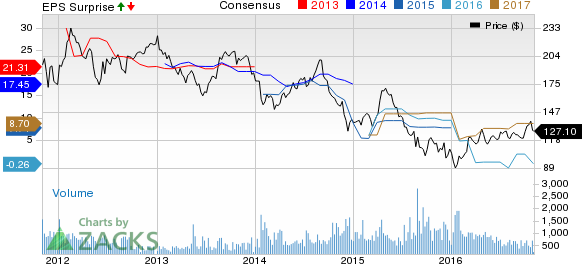
CNOOC LTD ADR Price, Consensus and EPS Surprise
CNOOC LTD ADR Price, Consensus and EPS Surprise | CNOOC LTD ADR Quote
Capital Expenditure
During the third quarter, CNOOC’s capital expenditure was 11.67 billion yuan, down 20.9% from the year-earlier period. The Chinese firm used the capital mainly to enhance efficiency and lower costs to combat falling oil price.
Discoveries
During the third quarter, CNOOC made one new discovery and drilled 10 appraisal wells in offshore China.
Other News
CNOOC brought online Weizhou 6-9/6-10 comprehensive adjustment project and Enping 18-1 oilfield. All the four projects expected to begin in 2016 were commissioned.
Zacks Rank
Currently, CNOOC carries a Zacks Rank #4 (Sell). Some better-ranked players in the energy sector are Enbridge Energy Partners, LP (NYSE:EEP) , Braskem SA (NYSE:BAK) and Enviva Partners, LP (NYSE:EVA) . Each of these stocks sports a Zacks Rank #1 (Strong Buy). You can see the complete list of today’s Zacks #1 Rank stocks here.
Enbridge Energy Partners has an impressive earnings surprise history. The partnership posted positive earnings surprises in three of the last four quarters. It reported a positive earnings surprise of 69.23% in the preceding quarter.
Braskem SA posted a positive earnings surprise of 105.45% in the year-ago quarter.
Enviva Partners has a mixed earnings surprise history. The partnership posted positive earnings surprises in two of the last four quarters. It reported a positive earnings surprise of 20.51% in the preceding quarter.
Confidential from Zacks
Beyond this Analyst Blog, would you like to see Zacks' best recommendations that are not available to the public? Our Executive VP, Steve Reitmeister, knows when key trades are about to be triggered and which of our experts has the hottest hand. Click to see them now>>
CNOOC LTD ADR (CEO): Free Stock Analysis Report
ENBRIDGE EGY PT (EEP): Free Stock Analysis Report
BRASKEM SA (BAK): Free Stock Analysis Report
ENVIVA PARTNERS (EVA): Free Stock Analysis Report
Original post