
T2108 Status: 59.1%
VIX Status: 12.1%
General (Short-term) Trading Call: Hold (Bullish)
Active T2108 periods: Day #303 over 20% (includes day #280 at 20.01%), Day #17 over 40%, Day #14 over 50% (overperiod), Day #2 under 60%, Day #43 under 70%
Commentary
Market conditions turned a bit ominous at the close of trading on Wednesday, September 3rd. I was on the lookout for follow-through. Sure enough, the next day, sellers were able to send the S&P 500 (SPDR S&P 500 (ARCA:SPY)) and the NASDAQ (PowerShares QQQ (NASDAQ:QQQ)) down again, even if marginally. In particular the NASDAQ Composite broke its primary uptrend by closing below the first Bollinger Band® (BB). On Friday, the S&P 500 came roaring back from initial selling to close with a fresh all-time closing high. The NASDAQ suddenly found itself slightly under-performing as its comeback did not wipe out the bearish read from Wednesday.
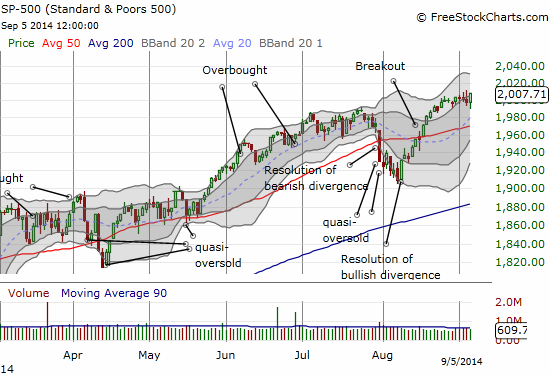
The S&P 500 wipes out bearish tidings in one swift intra-day reversal
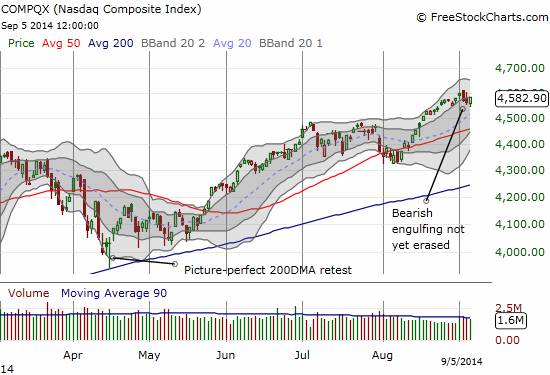
The NASDAQ’s comeback still leaves the index contending with an ominous bearish engulfing pattern
This is what I call a close call. On Friday morning, I was mentally writing an incrementally more bearish stock market update. Instead, I am now writing a mixed piece that maintains the bullish bias in the trading call. There is one caveat: T2108 is still well off its recent high for this cycle.
T2108 closed at 59.1%. It was as high as 65.5% on Wednesday before the market faded. This behavior is not a bearish divergence because T2108 closed with a gain, not a loss. What has my attention right now is T2108 lagging the S&P 500. The lagging takes on more weight with the NASDAQ’s performance and loss of its primary uptrend. It is not likely such lagging can persist for long without the S&P 500 reversing, so I am “on alert.”
Finally, traders must pay closer attention to currency markets if they have gotten in the habit of ignoring them. I wrote a related piece called “The U.S. Dollar Is Strong But…What About Carry?” In particular, the ECB’s push to ramp up liquidity in the eurozone economy provides a fresh source of funds to fuel more trades, more investments, and even less volatility. Weary bears are facing an army with supply lines restocked, re-fortified, and ammunition for as far as the radar can see. I think the resolution of these new battle lines will become pretty apparent in the coming weeks. Stay tuned.
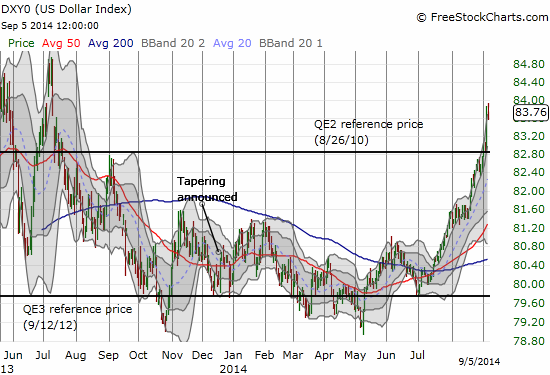
The U.S. dollar index finally breaks out
Daily T2108 vs the S&P 500

Black line: T2108 (measured on the right); Green line: S&P 500 (for comparative purposes)
Red line: T2108 Overbought (70%); Blue line: T2108 Oversold (20%)
Weekly T2108

Be careful out there!
Full disclosure: no positions