
The first chart below illustrates the strength of Financials over the past year. As of Friday's close, the Financial Select Sector SPDR Fund (XLF) has risen 31% more than the S&P 500 (US 500) (26.0% versus 19.9%) and Citigroup (C) is even stronger, outstripping the SPY ETF by nearly 49% (29.5% versus 19.9%).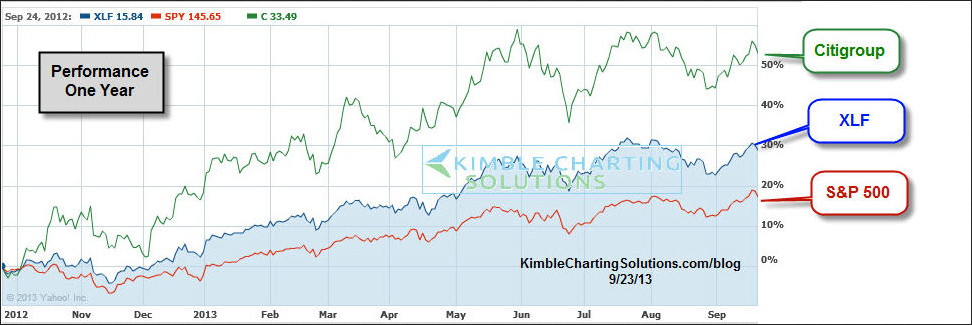
The next chart shows that XLF and Citigroup both created rather large bearish wicks last week. Citigroup is at the top of its sideways channel, which it has had a hard time breaking from since the highs it reached back in 2009.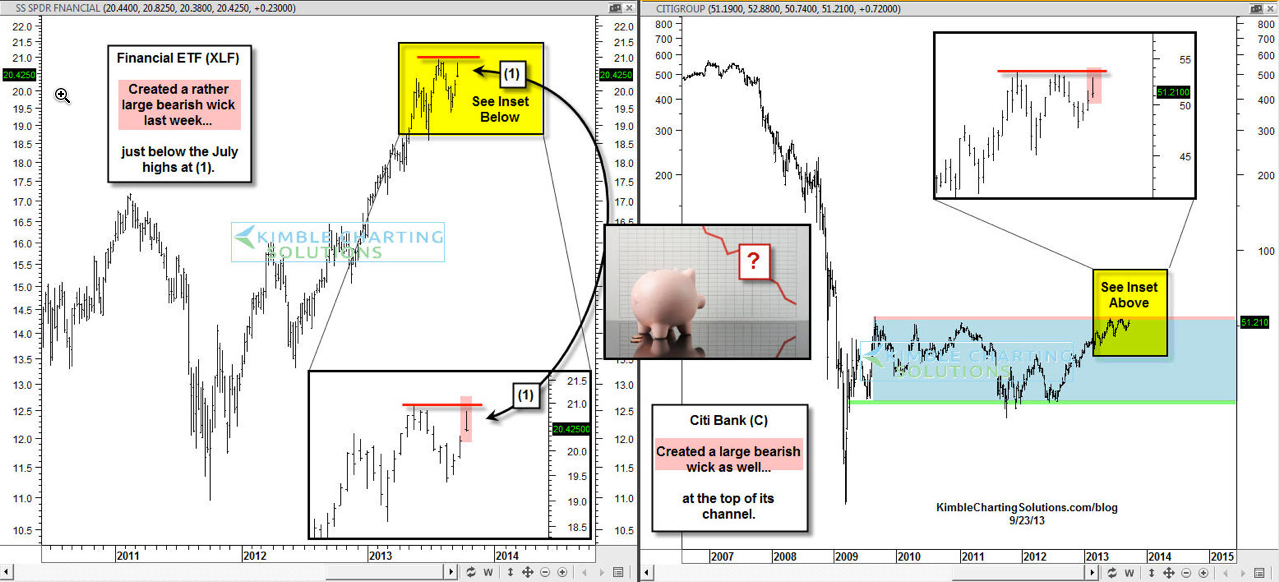
Watch For Impact
Financials have been a relative strength winner over the past few years. Keep an eye on them in the near future, in light of last week's bearish wicks. If they happen to head lower, they could negatively impact the S&P 500 going forward.
- English (UK)
- English (India)
- English (Canada)
- English (Australia)
- English (South Africa)
- English (Philippines)
- English (Nigeria)
- Deutsch
- Español (España)
- Español (México)
- Français
- Italiano
- Nederlands
- Português (Portugal)
- Polski
- Português (Brasil)
- Русский
- Türkçe
- العربية
- Ελληνικά
- Svenska
- Suomi
- עברית
- 日本語
- 한국어
- 简体中文
- 繁體中文
- Bahasa Indonesia
- Bahasa Melayu
- ไทย
- Tiếng Việt
- हिंदी
Citigroup Casts Large Bearish Wick Over Financials
Published 09/23/2013, 12:57 PM
Updated 07/09/2023, 06:31 AM
Citigroup Casts Large Bearish Wick Over Financials
Latest comments
Install Our App
Risk Disclosure: Trading in financial instruments and/or cryptocurrencies involves high risks including the risk of losing some, or all, of your investment amount, and may not be suitable for all investors. Prices of cryptocurrencies are extremely volatile and may be affected by external factors such as financial, regulatory or political events. Trading on margin increases the financial risks.
Before deciding to trade in financial instrument or cryptocurrencies you should be fully informed of the risks and costs associated with trading the financial markets, carefully consider your investment objectives, level of experience, and risk appetite, and seek professional advice where needed.
Fusion Media would like to remind you that the data contained in this website is not necessarily real-time nor accurate. The data and prices on the website are not necessarily provided by any market or exchange, but may be provided by market makers, and so prices may not be accurate and may differ from the actual price at any given market, meaning prices are indicative and not appropriate for trading purposes. Fusion Media and any provider of the data contained in this website will not accept liability for any loss or damage as a result of your trading, or your reliance on the information contained within this website.
It is prohibited to use, store, reproduce, display, modify, transmit or distribute the data contained in this website without the explicit prior written permission of Fusion Media and/or the data provider. All intellectual property rights are reserved by the providers and/or the exchange providing the data contained in this website.
Fusion Media may be compensated by the advertisers that appear on the website, based on your interaction with the advertisements or advertisers.
© 2007-2024 - Fusion Media Limited. All Rights Reserved.