: 48.0%
VIX Status: 13.9
General (Short-term) Trading Call: Hold
Commentary
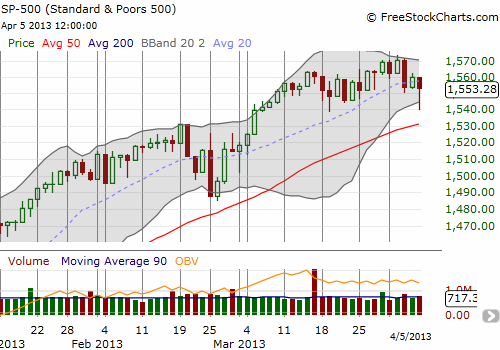
As luck would have it, the SSO put I bought on Thursday to play the T2108 Model tripled in value when I sold it in the wake of Friday’s opening sell-off. The S&P 500 trembled as U.S. unemployment numbers were much worse than expected. However, after the index tagged its lower-Bollinger Band®, I realized the action set up a fresh buying opportunity. I am now long the ProShares Ultra S&P 500 ETF (SSO) calls.
Those calls increased in value over 30% by the close as the S&P 500, almost predictably, bounced off the lower-BB. After it is all said and done, the S&P 500 has still gone nowhere for a month.
The opening excitement drove the VIX right to its 200DMA and just above the all-important resistance/support level of 15.3. Again, almost predictably, the VIX soon faded from these resistance levels and closed right where it closed the previous day. This action sets up a likely positive day on Monday where I will most likely sell my SSO calls.
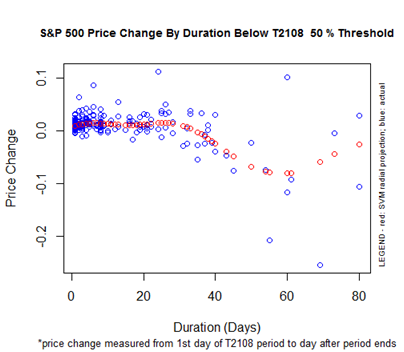
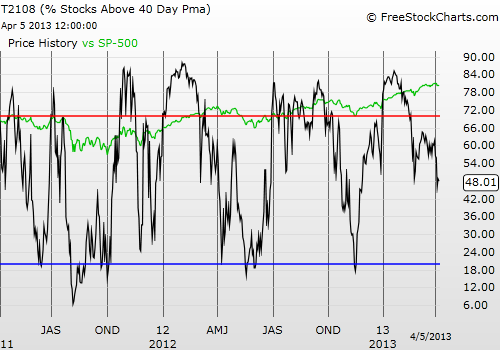
T2108 dropped just slightly to 48.0%. It first dropped below 50% two days ago. The S&P 500′s performance since then is exactly 0%. This is important because my T2108 model suggests the S&P 500 will have a positive bias until this “under period” lasts about 30 days.
The chart below shows historical performance of the S&P 500 from the first day T2108 closes below 50% to the first day it rises above 50%. The blue dots show actual performance. The red dots show the predicted performance (using Support Vector Machines {SVM} with a radial projection for you data mining/machine learning types). The x-axis measures how long (the duration) T2108 remains below the 50% threshold.
What this chart does not show is the range of expected performance WHILE T2108 makes it way above the 50% threshold again. Making the drawdown risks explicit is one of the many to-dos ahead of me before I fully publish my results of the T2108 overhaul.
Note well that being able to examine S&P 500 behavior above and below ANY threshold is one of the several improvements I have made. This rethink is part of what makes the concepts of overbought and oversold a lot more squishy and a little less relevant to the overall analytic framework. Stay tuned for more.
Black line: T2108 (measured on the right); Green line: S&P 500 (for comparative purposes)
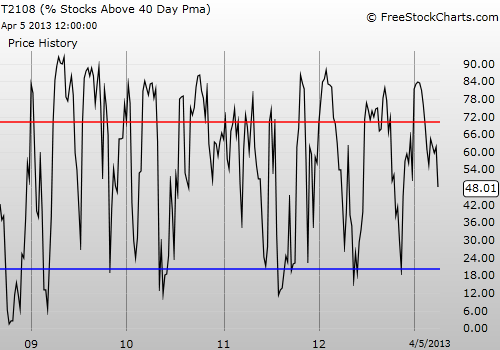
Red line: T2108 Overbought (70%); Blue line: T2108 Oversold (20%)
Be careful out there!
Disclosure: long VXX shares and puts; long SSO calls
- English (UK)
- English (India)
- English (Canada)
- English (Australia)
- English (South Africa)
- English (Philippines)
- English (Nigeria)
- Deutsch
- Español (España)
- Español (México)
- Français
- Italiano
- Nederlands
- Português (Portugal)
- Polski
- Português (Brasil)
- Русский
- Türkçe
- العربية
- Ελληνικά
- Svenska
- Suomi
- עברית
- 日本語
- 한국어
- 简体中文
- 繁體中文
- Bahasa Indonesia
- Bahasa Melayu
- ไทย
- Tiếng Việt
- हिंदी
Churn Continues. Positive Bias Remains.
Published 04/07/2013, 02:42 AM
Updated 07/09/2023, 06:31 AM
Churn Continues. Positive Bias Remains.
T2108 Status
3rd party Ad. Not an offer or recommendation by Investing.com. See disclosure here or
remove ads
.
Latest comments
Install Our App
Risk Disclosure: Trading in financial instruments and/or cryptocurrencies involves high risks including the risk of losing some, or all, of your investment amount, and may not be suitable for all investors. Prices of cryptocurrencies are extremely volatile and may be affected by external factors such as financial, regulatory or political events. Trading on margin increases the financial risks.
Before deciding to trade in financial instrument or cryptocurrencies you should be fully informed of the risks and costs associated with trading the financial markets, carefully consider your investment objectives, level of experience, and risk appetite, and seek professional advice where needed.
Fusion Media would like to remind you that the data contained in this website is not necessarily real-time nor accurate. The data and prices on the website are not necessarily provided by any market or exchange, but may be provided by market makers, and so prices may not be accurate and may differ from the actual price at any given market, meaning prices are indicative and not appropriate for trading purposes. Fusion Media and any provider of the data contained in this website will not accept liability for any loss or damage as a result of your trading, or your reliance on the information contained within this website.
It is prohibited to use, store, reproduce, display, modify, transmit or distribute the data contained in this website without the explicit prior written permission of Fusion Media and/or the data provider. All intellectual property rights are reserved by the providers and/or the exchange providing the data contained in this website.
Fusion Media may be compensated by the advertisers that appear on the website, based on your interaction with the advertisements or advertisers.
© 2007-2024 - Fusion Media Limited. All Rights Reserved.
