
China Unicom Hong Kong Ltd. (NYSE:CHU) reported disappointing financial results in the first half of 2016. Net income in the first half of 2016 was approximately $211 million, down significantly by 79.6% year over year. This poor performance was largely attributed to a 33.8% increase in network, operation & support expenses along with an 11.7% increase in other operating expenses.
Revenues
Total revenue was down 3.1% year over year to approximately $21,033.8 million in the first half of 2016. In the reported period, total Service revenue came in at approximately $18,287 million (constituting 86.9% of the total revenue), up 1.4% year over year. Revenues from Telecom Product Sales were about $2,751.3 million, down by a substantial 24.9% from the year-ago period.
Within the Service segment, Mobile revenues were approximately $10,956 million, down 0.6% and Fixed-Line Revenues were $7,234.5 million, up 4.4% year over year. Other service revenues grossed $96.5 million, up 4.4% year over year.
Expenses and Margins
In the first half of 2016, total operating expenses increased 2% year-over-year to around $20,363 million. Operating profit in the reported period was $273.6 million, down a substantial 79.6% year over year. Operating margin was 1.3% compared with 6.2% in the prior-year period. EBITDA in the first half of 2016 came in at around $6,192.3 million, down 18.2% year over year. EBITDA margin was 33.9% against 42% in the prior year.
Liquidity and Cash Flow
As of Jun 30, 2016, China Unicom had approximately $3,182.1 million of cash & marketable securities and $7,976.4 million of total debt outstanding in its balance sheet. In the first half of 2016, China Unicom generated approximately $6,289.5 million of cash from operations, up 9.5% year over year. Free cash flow was around $3,574 million, up a whopping 181.9% year over year.
Subscribers Statistics
As of Jun 30, 2016, China Unicom had 260.703 million (down 9.3% year over year) mobile subscribers, of which, 72.417 million were super-fast 4G users. The company added 13.116 million 4G subscribers in the second quarter and gained 1.774 million overall mobile customers. Mobile billing subscriber average revenue per user (ARPU) was around $7.1 and 4G ARPU was around $11.91.
Fixed-line broadband subscriber base totaled 73.938 million, up 4.7% year over year. The company added a net 0.533 million fixed-broadband subscribers in the second quarter. Fixed-line local access subscriber base was 70.522 million, down 10.1% year over year. The company also lost net 1.513 million fixed-access subscribers in the second quarter.
CHINA UNICOM Price, Consensus and EPS Surprise
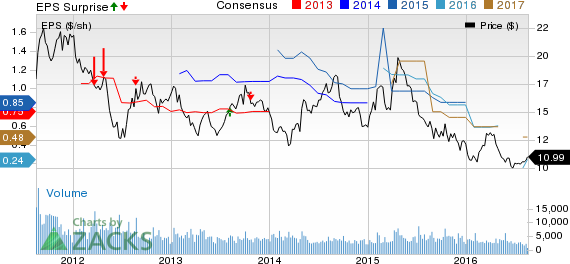
CHINA UNICOM Price, Consensus and EPS Surprise | CHINA UNICOM Quote
Zacks Rank & Stocks to Consider
China Unicom currently carries a Zacks Rank #3 (Hold). Some better-ranked stocks in the non-U.S. telecom industry include SK Telecom Co. Ltd. (NYSE:SKM) , KT Corp. (NYSE:KT) and Telecom Italia (MI:TLIT) S.p.A. (NYSE:TI) . All three stocks current enjoy a Zacks Rank #2 (Buy).
KT CORP (KT): Free Stock Analysis Report
TELECOM ITA-ADR (TI): Free Stock Analysis Report
CHINA UNICOM (CHU): Free Stock Analysis Report
SK TELECOM CO (SKM): Free Stock Analysis Report
Original post
Zacks Investment Research