Forex News and Events
Swiss franc boosted by solid trade data
Swiss trade surplus improved slightly in April. Exports expanded 6.2%y/y in nominal terms in April - or a contraction of 0.6%y/y in real terms - after expanding 0.5% y/y in March. Imports increased 8.2%y/y versus 0.8%y/y in the previous month - or 3.2%y/y in real terms. Overall, the trade surplus printed at CHF2.5bn in April from an upwardly revised increase of 2.18bn in March.
The strong figures came on the back of solid exports of chemical and pharmaceutical products to the European Union (+8%) - mostly Germany - and the US (+14%). Exports for the latter rose 23.5% in April compared to 12 months ago. On the other hand, the watch industry continues its descent into hell with another contraction of 15.2%y/y in nominal terms as the demand from China and Asia continues its free fall.
EUR/CHF returned below the 1.11 threshold amid the release as the data suggests that the Swiss economy seemed to have weathered the slowing demand from Asia relatively well. However the encouraging results are mostly due to a solid demand for pharmaceutical and chemical products, while demand for other products remained roughly stable, with the exception of watch exports. We therefore remain cautious regarding further improvement of trade data, especially given the uncertainties surrounding the Chinese slowdown, which affects most economies.
Commodities currencies suffer
Against the dollar, commodities currencies such as the Aussie and the Loonie have retreated since the beginning of May. The AUD/USD lost 5.66% in a month, while the USD/CAD gained 4.93% during the same period. We believe this is because financial markets started to price in higher probabilities for June and September Fed rate hikes after multiple verbal interventions from Fed members. Recent market estimates for a June hike have increased from 4% to 32%.
Moreover, gold and silver went lower after markets priced in Fed comments on its monetary policy. Iron ore September future contracts also diminished and fell to a 3-month low. Nonetheless, from our vantage point, there will be no Fed rate hike in June as most data remains on the soft side. We also believe that the Reserve Bank of Australia and the Bank of Canada may wait a bit longer before cutting interest rates again. As a result risk-off sentiment is not dead but for the time the AUD and the CAD should further suffer within the next few weeks. We are prepared to reload our long AUD/USD position around 0.7000 and our short USD/CAD towards 1.3300.
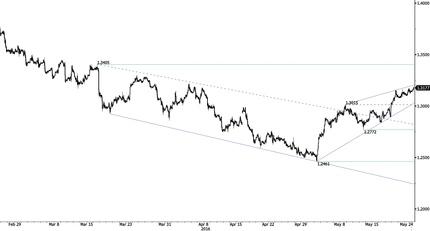
USD/CAD - Monitoring Uptrend Channel.


The Risk Today
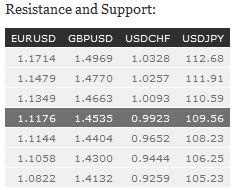
EUR/USD EUR/USD keeps on declining and is approaching hourly support at 1.1144 (24/03/2016 low) while hourly resistance is located at 1.1349 (17/05/2016 high). Stronger resistance lies at 1.1616 (12/04/2016 high). The technical structure suggests further downside moves. In the longer term, the technical structure favours a bearish bias as long as resistance at 1.1714 (24/08/2015 high) holds. Key resistance is located at 1.1640 (11/11/2005 low). The current technical appreciation implies a gradual increase.
GBP/USD GBP/USD is trading mixed. Hourly support is given at 1.4404 (15/05/2016 low) while hourly resistance can be found at 1.4663 (19/05/2016 high). Stronger resistance is located at 1.4770 (03//2016 high). Expected to show continued strengthening as the pair lies within an uptrend channel. The long-term technical pattern is negative and favours a further decline towards key support at 1.3503 (23/01/2009 low), as long as prices remain below the resistance at 1.5340/64 (04/11/2015 low see also the 200 day moving average). However, the general oversold conditions and the recent pick-up in buying interest pave the way for a rebound.
USD/JPY USD/JPY is back below 110. Strong resistance is given at 111.91 (24/04/2016 high). Hourly support lies at 108.72 (18/05/2016 low). Expected to show further weakening towards 108.72 as the medium term momentum is oriented downwards. We favour a long-term bearish bias. Support at 105.23 (15/10/2014 low) is on target. A gradual rise towards the major resistance at 135.15 (01/02/2002 high) seems now less likely. Another key support can be found at 105.23 (15/10/2014 low).
USD/CHF USD/CHF's bullish momentum is still on but we are approaching the end of the symmetrical triangle. Hourly resistance can be found at 0.9932 (intraday high) while strong daily support is given at 0.9652 (06/05/2016 low). A break of this support would confirm significant selling pressures. Expected to show further bearish consolidation move. In the long-term, the pair is setting highs since mid-2015. Key support can be found 0.8986 (30/01/2015 low). The technical structure favours a long term bullish bias.

